Coming down from a summer filled with local events and good eats, as well as being a proud Brooklynite, I couldn’t help but focus my mapping project on nearby food spots in my borough. Particularly, my map is a visual marking of Black-owned bars and restaurants in my borough. I came across Genese Jamilah’s article list, “Black Owned Restaurants and Bars in New York City and Brooklyn.” There, I extracted Brooklyn based businesses and pinned them on ArcGIS Story Maps. With zero familiarity with ArcGIS, I opted to explore a site cost-friendly and user-friendly. After figuring out gestures–such as dragging mistakes to the trash bin, marking an area with a diamond cursor to create a text box, I gradually grew comfortable with using ArcGIS for a linear map.
While pinning a business, I had access to provide a description of the place, along with a hyperlink to their websites or contact information, and even provide a picture. It can be seen that I attempted to provide an image of the restaurant Amarachi. However, ArcGIS does not provide a function in which users can drag the image to scale. It can be seen that the restaurant sign is partially cut off.
Image cutoff seen above.
Besides the procedural, this assignment led more personal inquiry on the topic. As I was mapping these businesses, I quickly realized the error in that I was mapping from a singular source. Jamilah’s article has many bars and restaurants users may find elsewhere, and more. These businesses all have websites, or Facebook, or Yelp. However, any Flatbush native can assert Jamaican-Guyanese restaurant, McBeans, or Peppa’s Jerk Chicken should be added to the map as well. Another error worth pointing out is that a few internet searches may not provide a comprehensive list, as there is a probability some establishments do not have an online existence.
Another personal inquiry while mapping was the non-existence of black-owned bars and restaurants to the left of Flatbush Avenue. Granted, although it was asserted before the businesses were listed from a single article, along with the knowledge that there may be a probable chance businesses are not present online, I could not help but obsess over the missing marking of black Brooklyn to the left.
Overall, ArcGIS Story Maps is a source I could rely on again for linear maps, and possibly integrate in a K-12 classroom on local history and businesses.
Since I have no experience with mapping, or other graphing or visualization tools, I felt at a loss to begin working on this assignment. I tried to consider a number of topic options, but one kept recurring. The phenomenon of state-enforced family separation in the 20th century is a topic I have wanted to explore since February 2018 when I attended a conference in Moscow and heard a paper entitled “Desired Children – Transnational adoption of Jewish child survivors in the immediate aftermath of Second World War.”
Much of the information that is accessible about the phenomenon of forced adoptions in the 20th century is brought to light by scholars and activists working in a particular region, often with significant personal investment in the history that they study and expose. I believe that a global conversation could help specialists working with these histories, particularly through: the validating process of being heard by sympathetic listeners outsides one’s own “bubbles”; comparison of research methods; comparison of experiences–biographies, healing, justice. Our mapping assignment struck me as an opportunity to think again about how I could facilitate such a conversation.
With trepidation, I turned to Olivia Ildefonso’s, “Finding the Right Tools for Mapping“, hoping I would find something that would feel accessible.I arranged time to work at the library so I could plunge right into the powerful ArcGIS on one of the library’s desktops. But the machine felt foreign, and I decided to try QGIS instead–it’s open source, and would work on my MacBook, so I might feel more comfortable. All I managed to do was to open an account and download the software and become re-intimidated. Since I had arranged to meet with Micki, I hoped she might be able to give me some magic key. In our meeting, Micki focused on the importance of choosing a realistic and appropriate question and data set. Whereas I saw the assignment as primarily an exercise in using the digital resources, I understood Micki’s perspective to prioritize thinking in map form, and then afterwards finding appropriate digital tools, preferably as simple as possible. My notes from the meeting read:
a question worth asking
a data set we can ask it of
a way of measuring that data that makes sense
I also have a few hand-drawn maps and diagrams that Micki created at our meeting, trying to help me think of other topics I could work on that would be more manageable than the highly-sensitive and complicated one I had suggested. Something that would not need an extensive investment of time in research and collection of data, but could still involve some creative conceptualization.
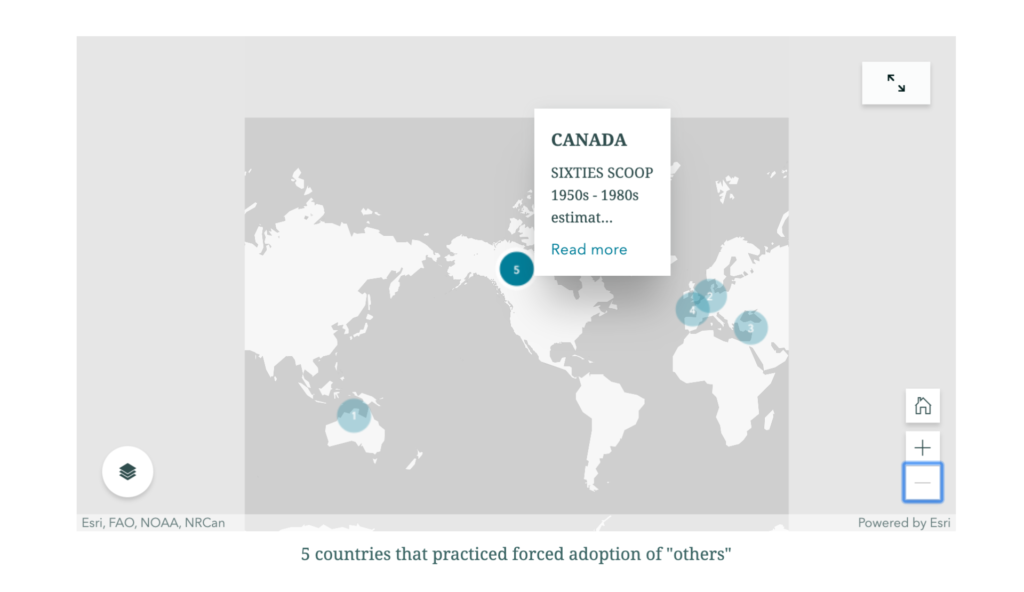
But I still felt stuck. I tried looking at Tableau and still could not find a way in to this world of mapping…. After our last class session, when Matt said our map topic could be as simple as something like “the last 5 places we’ve visited”, I decided that I would stick to the general topic I had chosen, but without asking any of the complicated questions that are on my wish-list to open up. I adopted the simple aim of plotting out 5 of the locations that I would want to include in a conversation that would bring together experts who research the topic of family separation in their home countries: The “Stolen Generations” in Australia, which I learned about when I lived in Sydney; the “Yemenite, Mizrahi, and Balkan Children Affair” which I learned about while living in Israel; the “Kinder der Landstrasse” and “Verdingkinder“ in Switzerland; the “Lost Children” of Francoist Spain, and the “Sixties Scoop” in Canada. And I decided to try Story Maps, since Robin had been very encouraging about its accessibility. At first, I found myself in a loop of Story Maps options, signed up (again?) for a trial of ARCGIS to gain access, and tried to check out “learning options”, before finally stumbling upon a template that seemed useable. I typed in my title– and saw that I could not control spacing or placement of the words. I adjusted the title, using the subtitle option, and once I became prepared to relinquish control, I did find the software to be quite user-friendly. It helped me to finally achieve my starting-point goal of a map that showed 5 places that were relevant for the topic of 20th century state-enforced family separation.
I could see how uninformative it was, but also felt I had a framework into which I could begin inserting information. So I added some data for each of the numbered locations, which would appear with hover feature:
I then re-numbered the countries to try to reflect some chronological order of when the policies of family separation were in place. Because of overlaps, I did not see how to make this order apparent to a user, though it did help me with my own visualizations, from Australia (#1) where policies began already in the 19th century, through Canada (#5) where they began in the 1960s and seem to have continued later than in the other countries. This very basic map, which managed to communicate at least something, at least to me, emboldened me to revise my minimal goal and try to produce a map that communicated the factors underlying the family-separation policies in some of the different locations. Twentieth-century western governments removed children from their families when they perceived the birth families as being of some “inferior” ethnicity/race, political affiliation, and socio-economic class. Racial/ethnic factors were relevant in four of the five countries I had chosen to mark on the map: Australia, Canada, Israel, Switzerland (Kinder der Landstrasse). Politics was the factor in Francoist Spain. Australia and Switzerland also had socio-economically-based policies/practices of family separation: Australia’s policy is sometimes called the “stolen white generations”, and in Switzerland, the Verdingkinder, “the contract children”, or “indentured child laborers”. This would mean figuring out how to include 2 factors in one location.If I managed to show the Verdingkinder factor in Switzerland, then I would add Ireland as an additional location that forced adoption on a socio-economic basis…. And maybe add Argentina as another location for political theft of children… And maybe figure out how to add data about the widespread policies and practices of removing children born to unwed mothers…. But… I was unable to figure out how to color-code in the Express Map, and still cannot think of a way to mark the factors by category using the tools that I see in the template. Since it is nearly time for class I am submitting this blog post with a link to the sad-looking product of my efforts, but with some guarded optimism about having embarked on a process, and maybe beginning to at least be able to formulate questions about how to move further. https://storymaps.arcgis.com/stories/cd582eb6436d47a88aae29724750c78c
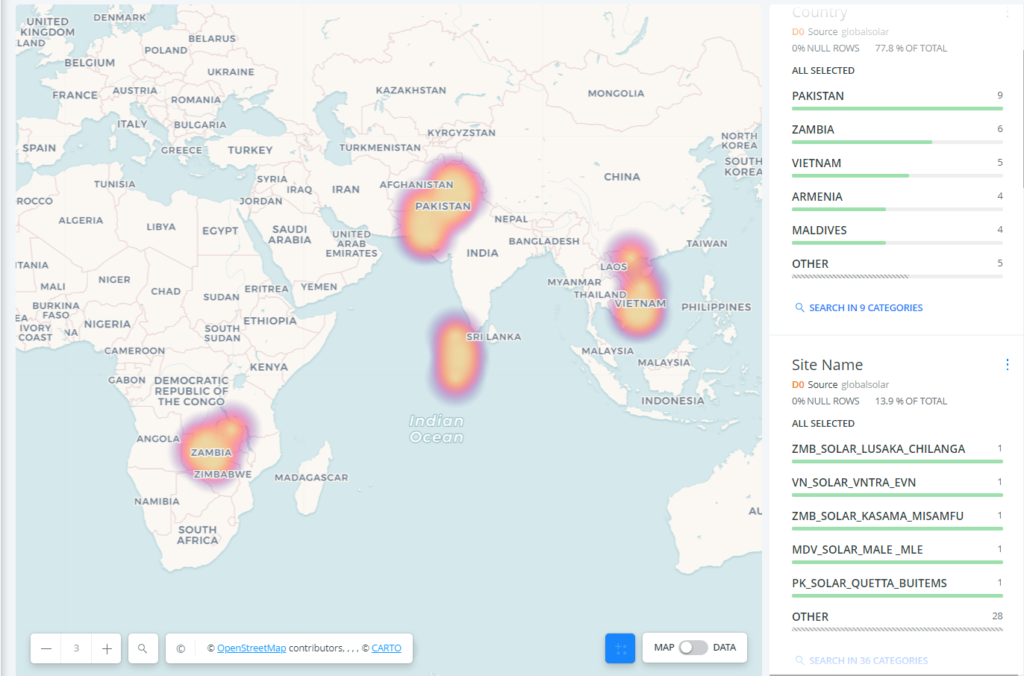
For my mapping assignment, I wanted to create a digital map of a ‘big problem, big solution’ topic. I set the widest parameters for my topic option while limiting my visualization options. I wanted my visualization to cover the globe or as much of it as possible and re-examine mapping from the standpoint of geospatial representation of place, identifiable by a coordinate pair of longitude and latitude. In my map, I sought to explore how global positioning is correlated to attainment in global development, how each country’s national development is always under the sphere of influence of local and global powers, why the notions of global north and global south exist, and how those representations can be harmful or helpful to developing nations.
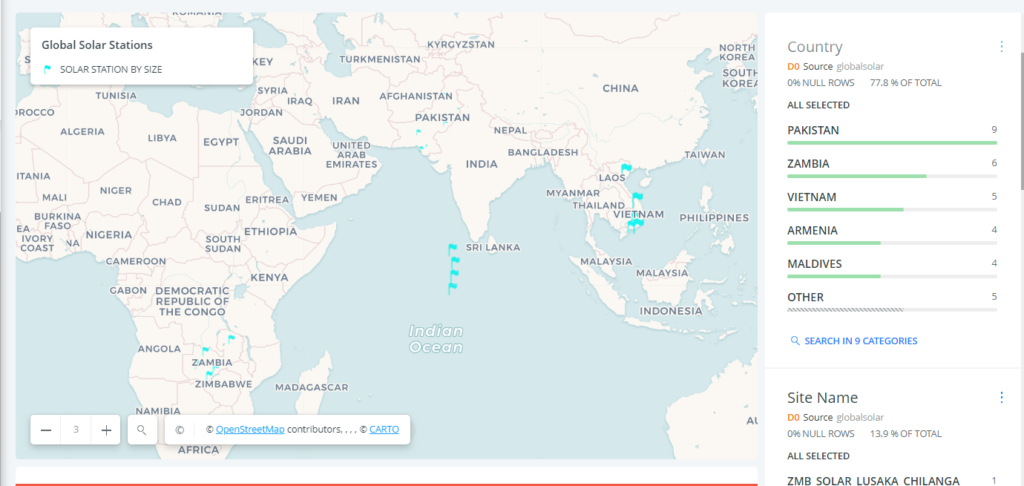
I landed on the ‘big problem, big solution’ issue of sustainable energy development where in the developing world measurable steps have been taken toward success in contrast to the developed world. I created a map of the inventory of global wind masts and solar stations from which there is access to measurement data. I gathered this data from 4 World Bank studies from 2012-2018. My interest in looking at this issue was very different from the organization who published these studies and the project funders attached to them.
The World Bank states that their interests in conducting these studies. “…aims to help improve developing countries’ knowledge and awareness of solar and wind resources.” The World Bank’s framing fails to point out that although these resources exist within the local borders of developing countries, the manufacturing of solar and wind energy is often controlled by global financial entities therefore making sustainable energy development in the global south interconnected with the policymaking and financial intervention of the global north. The reverse is also true. environmental pollution in the global north is interconnected with human development indices in the global south.
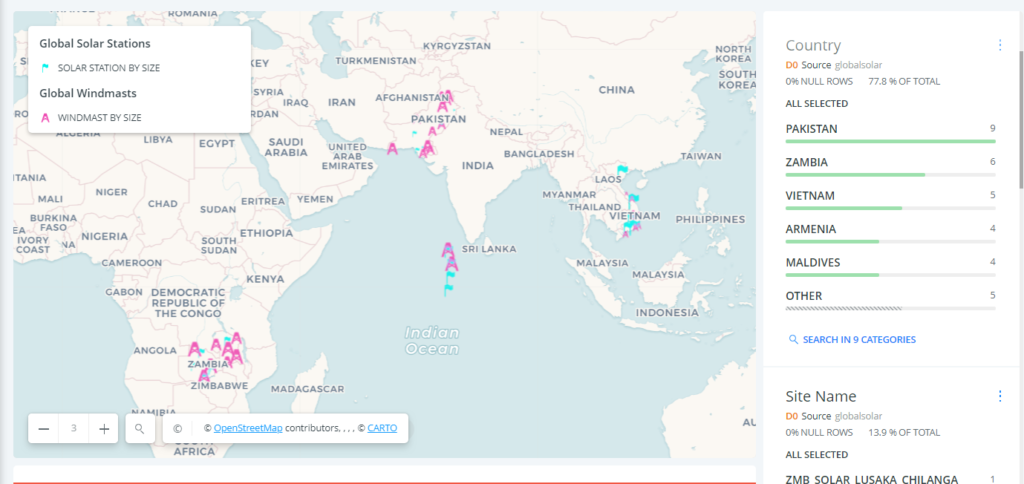
In terms of visualization, I developed my map through 4 layers of data. I decided to represent each inventory through a different color and symbol. The wind masts global inventory is represented in pink in the shape of a meteorological tower. The representation of each symbol is also determined by the size of each local inventory. For the solar global inventory, I assigned a blue flag in the size of each local inventory.
This map displays inventory of global wind masts in 2012this map displays inventory of global solar stations 2018
The third map aggregated both solar and wind inventories. There is clear evidence that project funders such as ESMAP who principally work to implement the UN Sustainable Development Goal 7 decided to focus on the same geographical spheres of influence with the exception of Armenia getting added to the solar inventory.
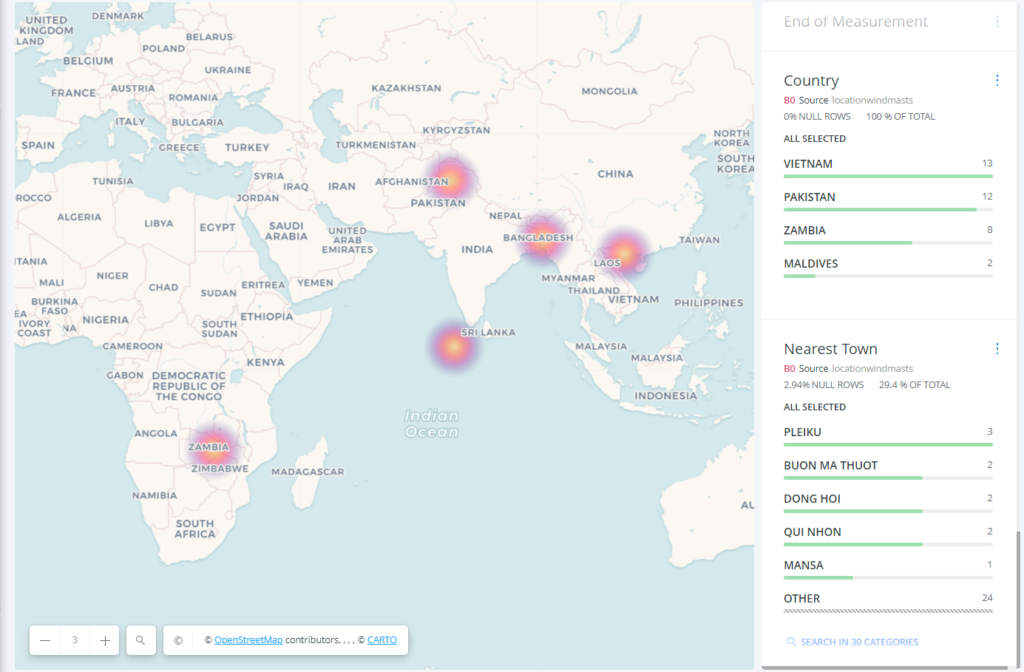
I also created a visualization option for the map to display pools of sustainable energy projects as opposed to individual projects.
Global Wind Mast inventory displayed as aggregated centers as opposed to individual projects Global Solar Stations inventory displayed as aggregated center as opposed to individual projects
The map also has a dynamic function which can display individual local inventory acquisition over time from the first inventory acquired to the last. This feature can only be accessed through the map page.
This map represents many things that I haven’t fully examined but in the most basic ways it answers our question about global positioning and its correlation to indices of human development. Sometimes global positioning means an absolute advantage in a natural resource such as solar energy development because a country is located near the equator. And mobilizing that particular resource whether for trade or other national interest is always interconnected to the influence of other powers which is why the same countries are the duplicate focus of both solar and wind energy development by global financial interests.
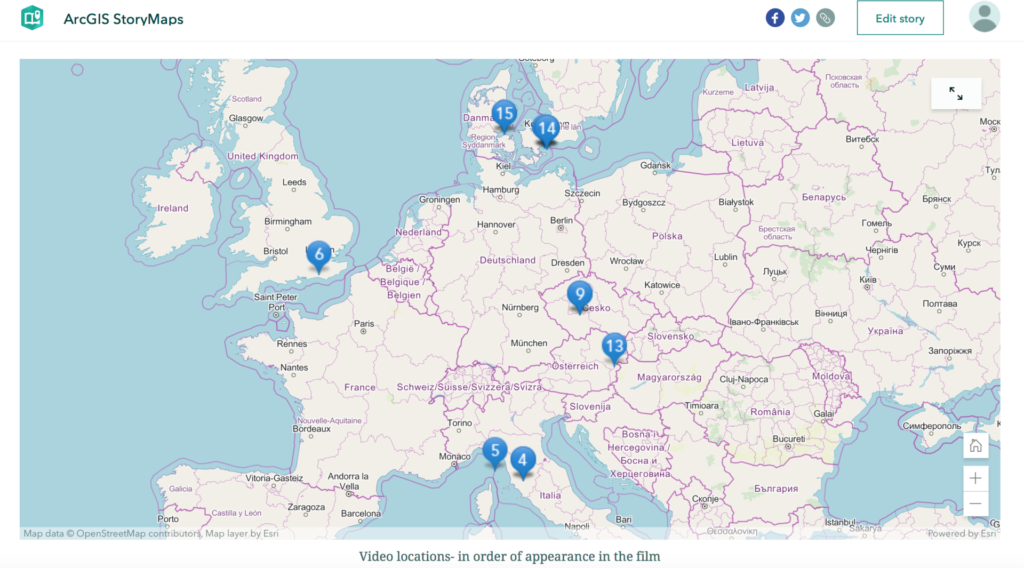
I have always considered the use of mapping as an interesting way to look at ‘lived experience’ and to learn more about constructed ideas of place within a space. For my mapping project, I took a tiny step toward exploring my own experience while studying abroad in the fall of 2016.
I decided to work with ArcGIS StoryMaps because I had worked with ArcGIS Desktop in the past and was interested to see how the online/public interface worked. I also chose this tool because it allowed me to incorporate other forms of media alongside my map rather easily.
While contemplating what to map I decided to focus on a film I created for a class in my undergraduate career that combined many video clips from my time abroad. This film served as a contained example of what I could do if I wanted to explore my entire abroad experience through my entire collection of photos and videos. For my base map, I chose to use the OpenStreetMap Vector base map because it resembles Apple Maps and Google Maps, both of which I used constantly when traveling abroad. By using the OpenStreetMap, I included an element of my experience that cannot be separated from my pictures and videos.
I started by plotting the exact location of each video clip on the map. I gave each point a number that corresponded to the order the video clip appeared in the film. For example, the first clip is from the rainbow panorama art installation at the Aarhus Art Museum in Aarhus, Denmark. This location is marked with a ‘1’ since it appeared in the film first. I experimented with the labeling of my points. For some, I gave the name of the location where the clip was filmed, for others I gave a descriptive title related to the content of the clip. If I continued working on this map, I think it would be useful to have the exact location of the photo or video along with a description of the content together because it would incorporate a geographical location with my interpretation/feelings/understanding of each location. I believe this to be more compelling when examining an individual’s ‘connection’ to a point in space.
I wanted to feature additional photos I took from the locations of the video clips on the map but I could not figure out a way to upload them without first bringing them online so they could be embedded. To remedy this, I chose to include photos within the storymap using the sidecar feature. I added three photos corresponding to the first three locations presented in the film. In the description box, next to each of the photos I listed a number that corresponds to the numbered location on the map. I also gave the name of the geographical location found on Google maps, as well as the date I visited each location. If I move forward with this project, I think it would be interesting to have each marked location on the map have a sidecar with additional photos of the landscape, photos of items collected from the site like a museum ticket, diary entries, and other media to create a fuller picture of my lived experience.
While working with ArcGIS StoryMaps, I did run into a few issues. Originally, I wanted to upload my film directly to the page but was unable to because it was in .mov format instead of .mp4. I had to embed the link to the film on YouTube to have it appear within my story. Some of my points are close together, so when the map is zoomed out not all points are visible. The scale of the map does not allow all points to be seen within the same frame; I think this diminishes the ability to geographically visualize the film as a whole because not all the locations are displayed. I already mentioned above my issue with adding photos to my map and my solution by using the sidecar feature. While this feature somewhat solves the problem, I think it creates distance between the film, map, and photos, causing them to seem disjointed. Ideally, an individual would see them all together, creating a fuller multimedia experience. By looking at each element separately it is harder to recreate my lived experience and does not allow for a user to explore/view the media together.
In my field of study, I think StoryMaps could be used to explore the lives of historical figures or even specific communities in a more expansive way. This tool allows for the visual exploration of many materials that allude to an individual or community’s perceptions of a place. Additionally, by attempting to create a map that reflects my experiences abroad, I think StoryMaps could be used outside academia as a social platform for displaying a person’s journey/experience/life. I won’t say if this could be good or bad, but it is thought-provoking in terms of social media’s role in the world today.
Idea: Map several active non-state mass societies. Why: The exclusion of non-state and anti-state perspectives from conventional political discourse produces an incomplete ideological spectrum which naturalizes the presence of the state.
Some issues to report:
Group Representation– A. Present or past and present – There are many concluded anti state experiments so it was a decision to start the project with a few active communities. By including past communities, a great deal of information regarding the trajectory of these ideas would be clarified in some instances, but wildly complicated in others.
B. Representation – The issue of uniting, through representation, stunningly diverse communities belonging to a loosely unified group marker(s). The issues of representing communities with a tendency not to represent themselves in concrete terms is something of an obstacle for practical and ethical reasons. Committing to a principle articulated by Jennifer Guiliano and Carolyn Heitman (Difficult Heritage and the Complexities of Indigenous Data, 2019), I intend to recognize “multiple ecosystems … related to data that must exist simultaneously and be treated as part of a nonhomogeneous whole.”
C. Misrepresentation – Running the risk of misrepresenting groups who are ambiguously aligned with anti-state sentiment. In some cases communities are not explicitly anti-state, but apolitical. It seemed better to separate out these distinctions than to run the risk of misrepresentation. At the same time, these exclusions risk misrepresenting groups that disregard that technicality.
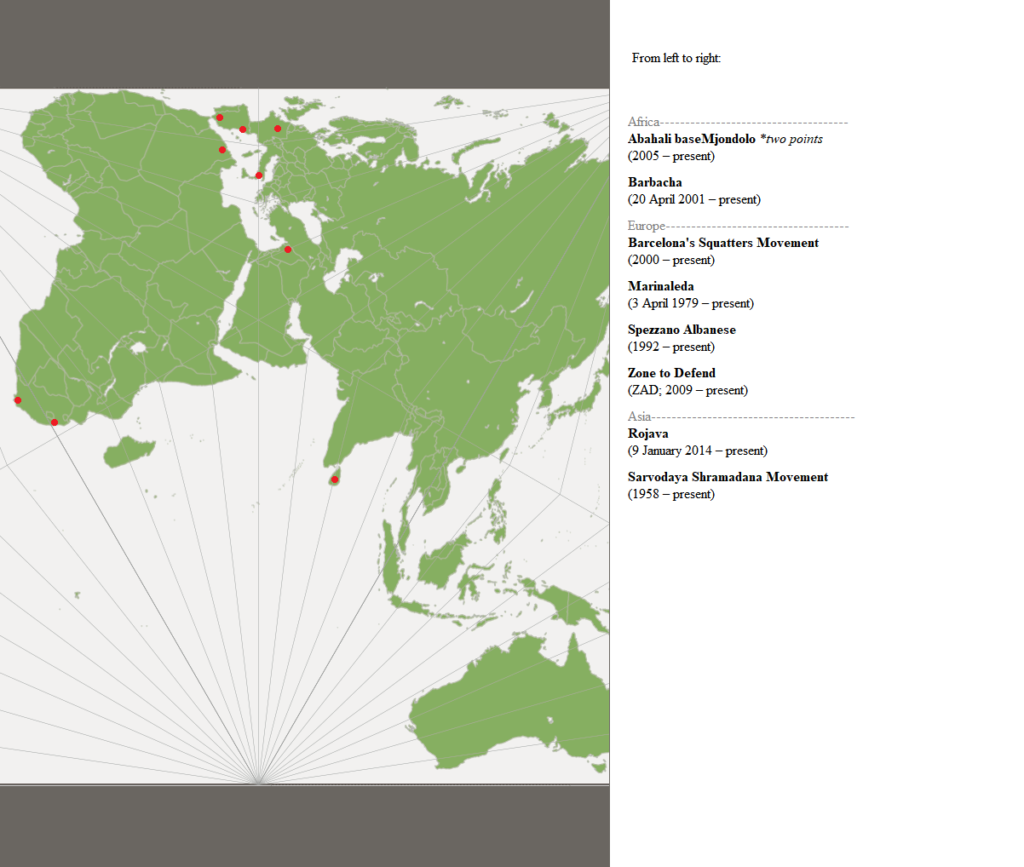
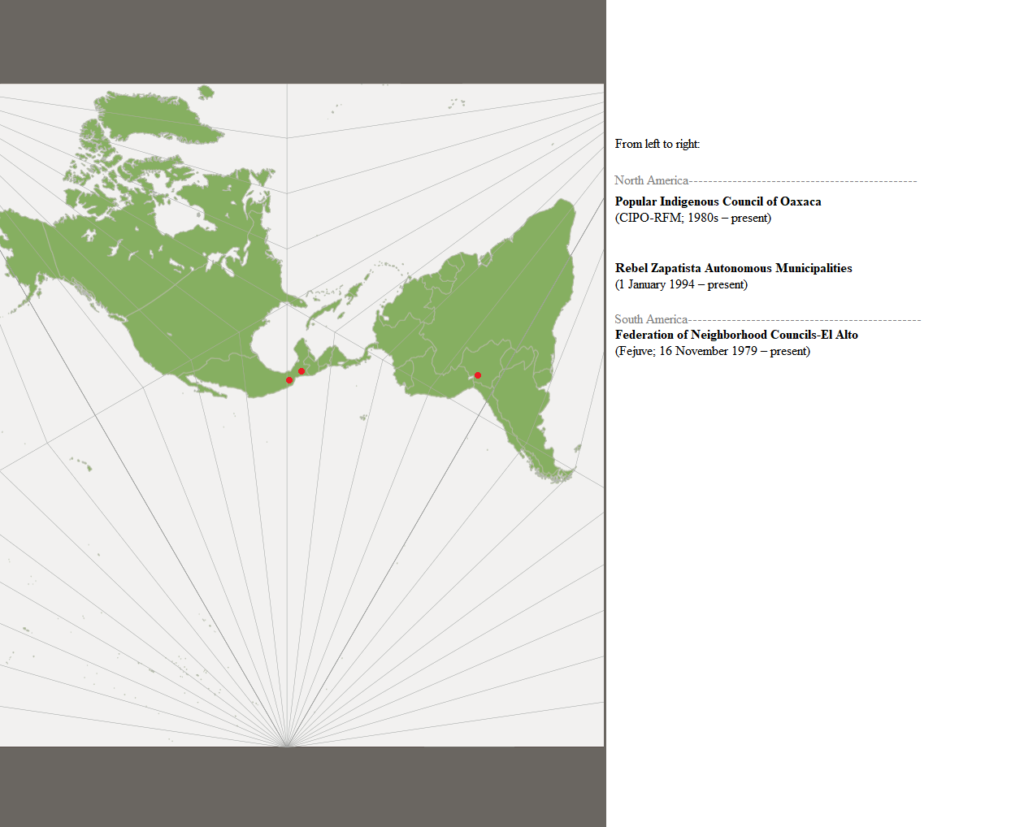
Data Representation– A. What do I want the data to reveal beyond merely presenting the existence of these groups?One of my goals is to represent connectedness of groups as something rhythmic and more contingent than what is expressed by legal or linguistic formalities that too often misrepresent reality and encumber human agency. For this reason, I’ve included an information sheet. It can be found below, with the title “Active, non-state mass societies on map”
B. What elements of the data should be privileged to make this point? – Population size, which would appear to be an obvious choice, proved to be an unskillful measurement in the context of this study. The choice to define the scope and domain of subject groups’ internal membership with a light touch prompted my use of the intentionally vague term “community” in favor of the prototypical population count. This decision is in some instances attributable to a group’s voluntarism, and in others representative of a non-paradigmatic conception of sovereignty. – Customs similarly seemed to miss the mark by giving the impression that non-state organization is specific to a particular society, place, or time, though in fact it is a ubiquitous cultural legacy. Equally problematic is the potential for the term “custom” to obscure the unique traditions, events, rituals and genuine customs shared within the group – as well as between one group and the society in which it is contained. For these reasons, the term “praxis” is used to denote the synthesis of theory and practice apparent in each group’s methods. This way, the data presents cultural distinction and methodological similarity without presuming the primacy of either. – Genealogy is used to indicate grounding principles and relevant ideological connections, with the risk of oversimplification hopefully outweighed by the benefit of concise reference points.
C. Names and figures The data is not necessarily uniform across multiple sources. When employed, averages and editorial decisions must be noted to preserve transparency.
Technical Limitations and Choosing Software – A. QGIS –——- My first inclination was to utilize open source software. I downloaded QGIS, for which the CUNY Graduate Center offers workshops, and immediately realized the software was too advanced for my current understanding. I switched to Tableau, which appears to function much more intuitively and offers web-based training videos.
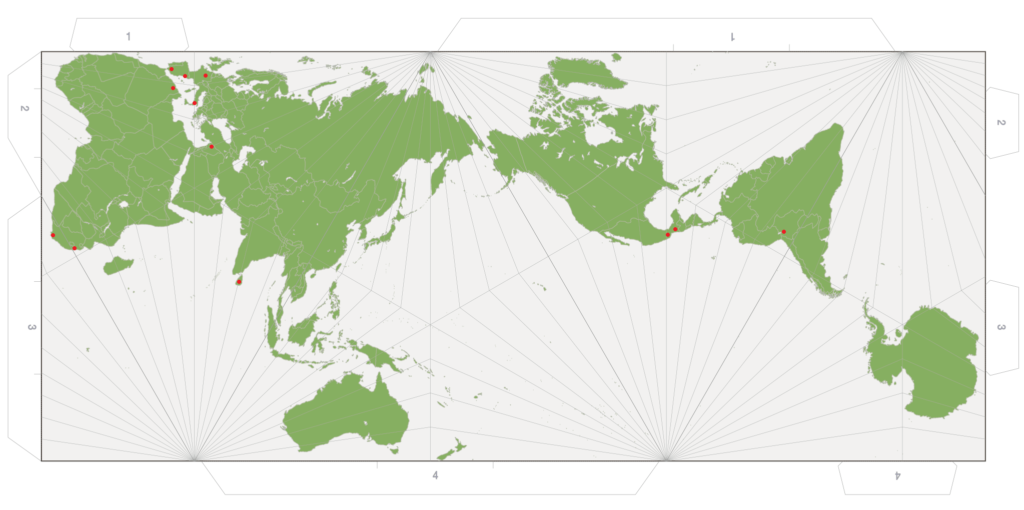
B. Tableau –——- b1. Working with Tableau Desktop software, I must first create an Excel spreadsheet because I am compiling my own data “set” from textual resources. Importing my data with the software is easy enough but I’ve now entered a labyrinth of software-particular jargon. Additionally the Tableau training videos are less than helpful in the context of applying my own data, which doesn’t meet the software’s standards. I begin to experiment and make some progress but choose to abandon Tableau upon realizing the software will not meet my standards for cartographic representation. b2. My chosen map template, based on the AuthaGraph World Map, is less than compatible for use in Tableau — The software’s process for working with longitude/latitude coordinates clashes with the design of the AuthaGraph map projection. This is a non-starter for me, for reasons I will explain below.
C. Static Map –——- I choose to create a static map and use slides for detail, rather than interactive mapping software.
Mapping Process –
A. Using AuthaGraph World Map as a template.
The Authagraph mapping projection, invented by Japanese architect Hajime
Narukawa in 1999, was selected by the Japanese National Museum of Emerging
Science and Innovation (Miraikan) as its official mapping tool in 2011 and
awarded the 2016 Good Design Grand Award from the Japan Institute of Design
Promotion.
According to the project website (authagraph.com) The map is
“made by equally dividing a spherical surface into 96 triangles,
transferring it to a tetrahedron while maintaining area proportions, and
unfolding it onto a rectangle … The map substantially preserves sizes and
shapes of all continents and oceans while it reduces distortions of their
shapes, as inspired by the Dymaxion map. The projection does not have some of
the major distortions of the Mercator projection, like the expansion of
countries in far northern latitudes, and allows for Antarctica to be displayed
accurately and in whole.” My image was sourced from (http://narukawa-lab.jp/archives/authagraph-map/)
My decision to use this map projection comes from a desire to represent space with minimal distortions, wary of the interplay between cartographic and ideological reproductions.
——- Active, non-state mass societies on map ——-
Sarvodaya Shramadana Movement (1958 – present)
Community: Programs active in some 15,000 (of 38,000)
villages in Sri Lanka. Approximately 11 million individual beneficiaries.
Praxis: Self-governance, village councils; collective
labor, distribution of group funds; building schools and clinics; family and
conflict resolution programs; starting a village bank and offering support to
other villages.
Genealogy: Buddhist tradition, Gandhian Anarchism
Federation of Neighborhood Councils-El Alto (Fejuve;16 November 1979 – present)
Community: 600 neighborhood councils in El Alto,
Bolivia.
Praxis: Self-governance, provincial councils,
consensus; worker’s self-management and common ownership; conflict resolution/
restorative justice; providing public services, water connections, sewerage
outlets, electrical cables and garbage collection services; building parks,
grade schools, clinics, housing, a public university and work cooperatives.
Genealogy: Aymara traditions, Revolutionary Syndicalism,
Anarchism
Marinaleda (3 April 1979 – present)
Community: 2,778
inhabitants; the whole municipality of Marinaleda, Seville province, in the
autonomous community of Andalusia, Spain.
Praxis: Municipal councils; communal property,
agricultural cooperatives, trade unionism, full employment; grants for home
construction, voluntary public services.
Genealogy: Social Democracy, Revolutionary
Syndicalism, Anarchism
Popular Indigenous Council of Oaxaca (CIPO-RFM; 1980s
– present)
Community: Twenty-six
rural communities in Oaxaca, Mexico
Praxis: Self-governance,
participatory democracy and consensus, autonomous communities; common ownership
of land, environmental protection, sabotage and direct action against private
industry; worker cooperatives, building schools and hospitals, maintaining a network
of autonomous community radio stations, educational outreach programs;
political representation of 26 different, mainly indigenous, communities
including Chatino, Mixtec, Chinantec, Cuicatec, Zapotec, Mixe, and Trique
peoples.
Genealogy: Green Anarchism, Anarcho-Communism
Spezzano Albanese (1992 – present)
Community: 6,990
inhabitants; the whole municipality of Spezzano Albanese, Cosenza Province in
Calabria, Italy.
Praxis: Dual power alternative to the local
government, participatory democracy; fund raising for the development of local
worker cooperatives and trade unions.
Genealogy: Anarchism
Rebel Zapatista Autonomous Municipalities (1 January
1994 – present)
Community: 363,583
inhabitants; 55 separate municipalities organized into 5 regions (currently
expanding as of October 2019)
Praxis: Self-governance, autonomous councils,
participatory democracy, consensus; sabotage and direct action against state
encroachment; promotion of education, health and arts (especially indigenous
language and traditions); worker cooperatives, family farms and community
stores; providing low-interest loans, free education, radio stations, universal
health-care; self-reliant economics, agricultural production; common ownership
of land, participation in international markets.
Community: 30,000+
inhabitants; 34 separate villages in the Kabylie region, Algeria
Praxis: Dual power alternative to the local
government, democratic assemblies modelled off traditional village councils;
sabotage and direct action against local courts, government offices, political
party offices, and police stations; councils coordinate further protests,
garbage collection, fuel distribution, cleaning, welfare programs and
maintenance for local schools and public services.
Genealogy: Amazigh tradition, Anarchism
Abahali baseMjondolo (2005 – present)
Community: 25,000+
active supporters in 64 different shack settlements across Durban,
Pietermaritzburg and Cape Town, South Africa
Praxis: Dual power institutions, direct democracy;
direct action such as land occupations and self-organized water and electricity
connections; tactical use of state courts to overturn laws unfavorable to shack
settlements; mutual aid projects like community kitchens and vegetable gardens;
dismissal of party politics, campaigns for public housing, occupation of unused
government land.
Genealogy: Marxism, Mutual Aid
Barcelona’s Squatters Movement (2000 – present)
Community: Thousands of inhabitants; around 200
squatted buildings and 40 social centres across Barcelona, Spain
Praxis: Squatting, anti-work philosophy; freely
fixing up houses, cleaning, patching roofs, installing windows, toilets,
showers, lights and kitchens; pirating electricity, internet and water;
providing social services to the surrounding residents, including bicycle
repair workshops, carpentry workshops, self-defense classes, free libraries,
community gardens, free meals, computer labs, language classes, theatre groups,
free medical care and legal support services; Helping elderly residents avoid
eviction; organizing protests.
Genealogy: Anarchism, Mutual Aid
Zone to Defend (ZAD; 2009 – present)
Community: Between
10 and 15 ZADs across France; no official figures.
Praxis: Squatting, voluntary organization,
maintaining permanent villages as blockades to development projects; sabotage
and direct action challenging large infrastructure projects in defense of the
environment; demonstrations to protect the biodiversity of the wetlands; mutual
aid projects, community farming and business.
Genealogy: Environmentalism, Anarchism
Rojava (9 January 2014 – present)
Community: 2 million+ inhabitants in the Kurdish region of northern Syria
Praxis: Dual power alternative to regional governments, federal system, direct democracy, municipal governance, local civic councils; community ownership, workers cooperatives; “co-governance” policy in which each position at each level of government in the region includes a female and a male; promoting decentralization, gender equality, environmental sustainability and pluralistic tolerance for religious, cultural and political diversity; oil, food and agricultural production.
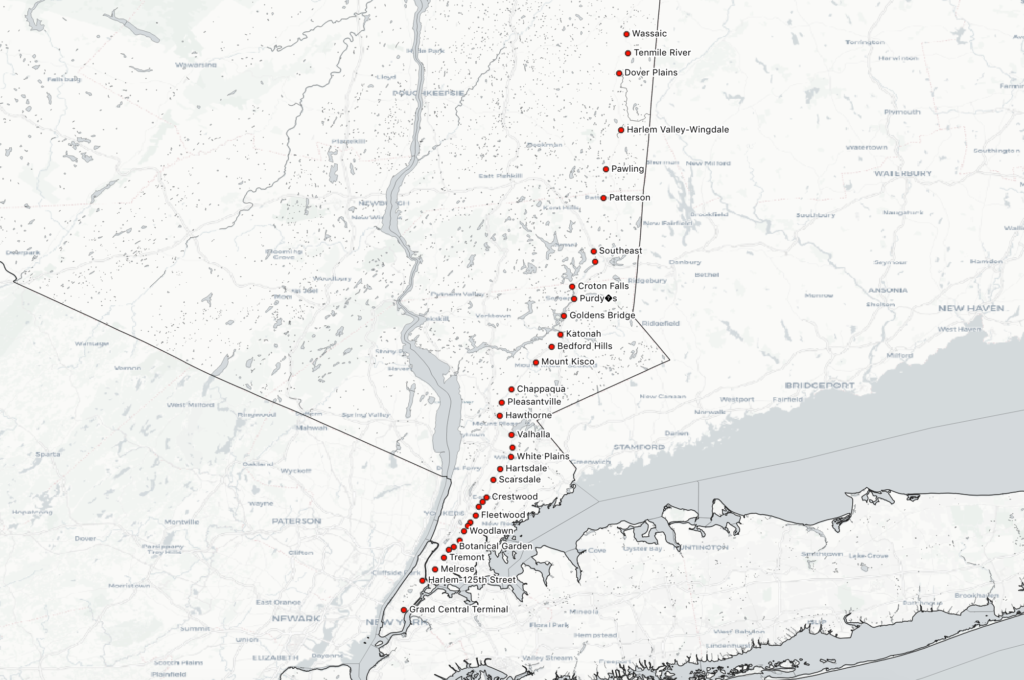
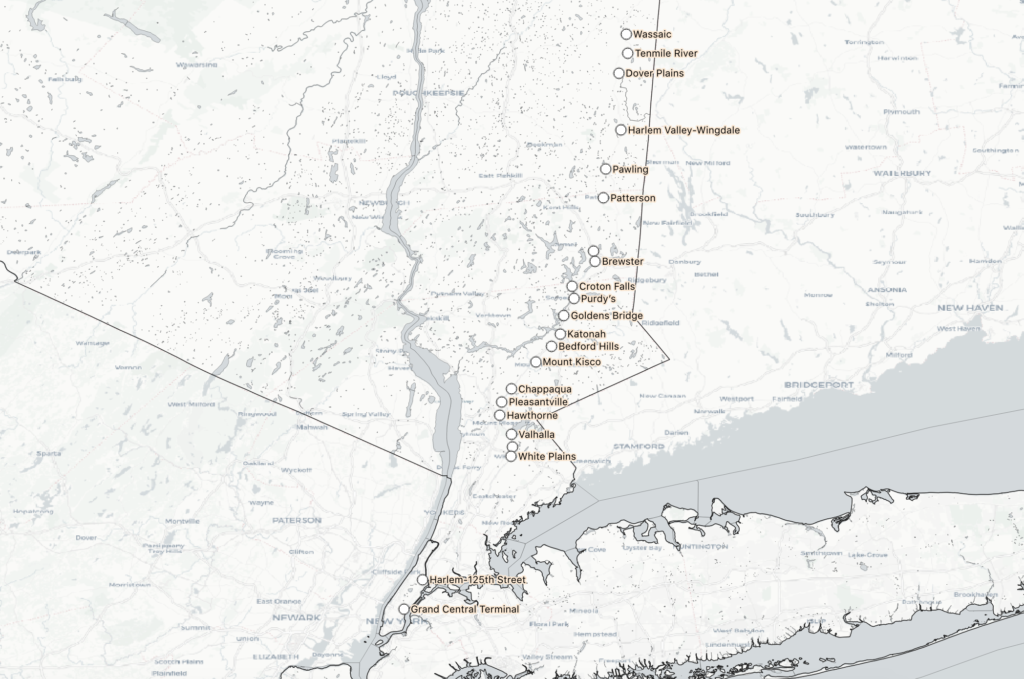
I grew up mostly in Westchester, and viewed MetroNorth Railroad (MNR) as an escape route from the suburbs. I lived along the Harlem Line, which makes stops between Grand Central Terminal and the ambiguously-named Southeast. Less than 10% of trains each day also connect to a transfer at Southeast that runs further north, an 30 additional miles up to Wassaic in Dutchess County. My most-traveled path is from the town where my parents live to Grand Central, off peak. However, the more I’ve taken the train in recent years (particularly when I take a new combinations of stops to reach my students via public transport, or when I ride at an unusual time), the more I observe that the Harlem Line train serves, obviously, many more purposes than just my own. I guess it’s what I already had words for from Kevin Lynch’s mental maps, but each person’s map of the same geography will be different.
Harlem Line Metro North Stops
This particular project was motivated by a phrase I had heard used a couple times in reference to this train line: “the nanny train.” This is a blunt shorthand for the observed phenomenon of women of color riding from stations in affluent, majority-white towns in Northern Westchester (where they work) to stations further south that generally serve communities of color in the Bronx and Southern Westchester (where they live). The question that motivated this map was “Is there actually a ‘nanny train,’ and can I visualize its existence?”
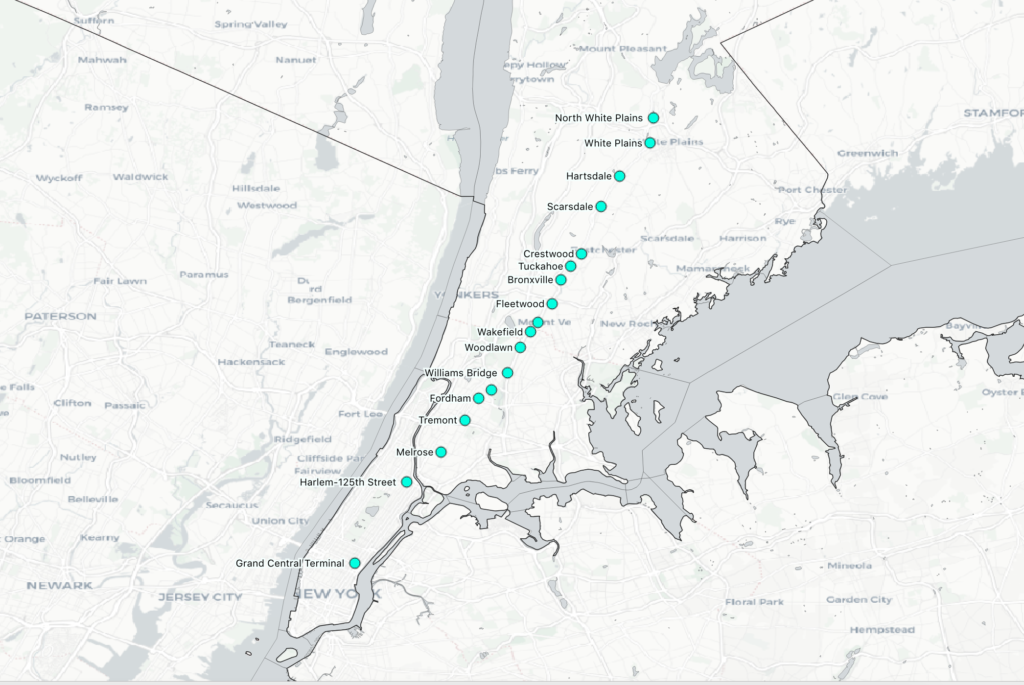
By and large, what I gleaned from scrutinizing the train schedule and counting up trips (not exhaustively, but carefully) is that Harlem Line trains make stops either south of White Plains and terminate at North White Plains (24 miles north of GCT), or begin making stops at White Plains and terminate at Southeast (53 miles north) or Wassaic (82 miles north). Out of 109 total trips per day to Grand Central (I did not include reverse trips in this map), 96 trips fell into one of these four patterns:
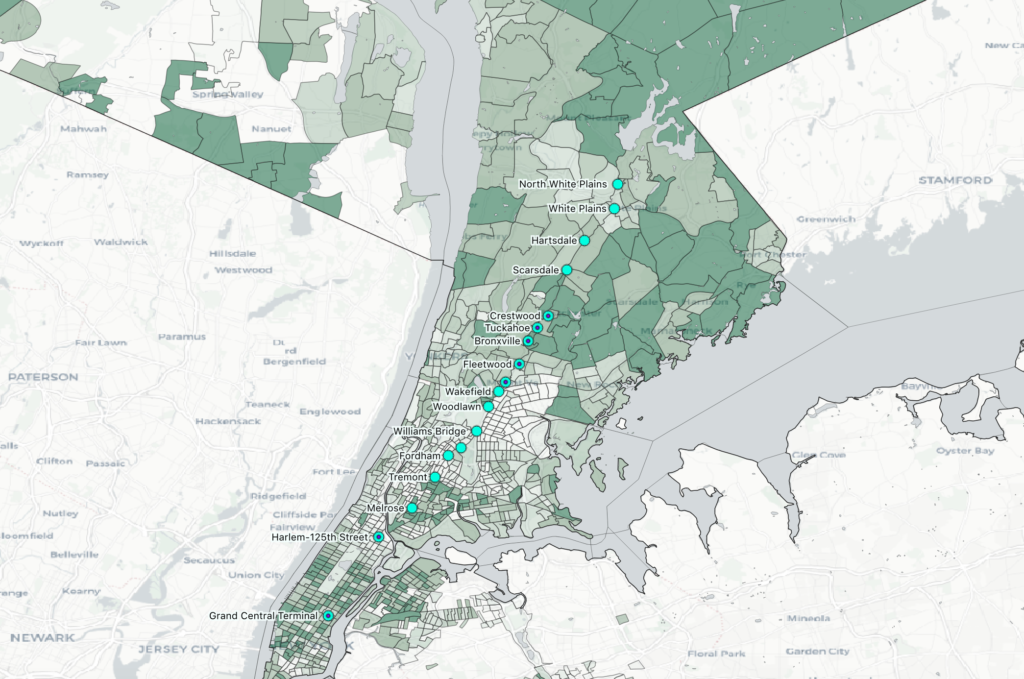
Group 1: begin at North White Plains, make at least 5 stops (i.e. make local stops in the Bronx)
Group 2: begin at Crestwood in Southern Westchester, make either 5 stops (express in peak hour) or 12 (all stops in the Bronx)
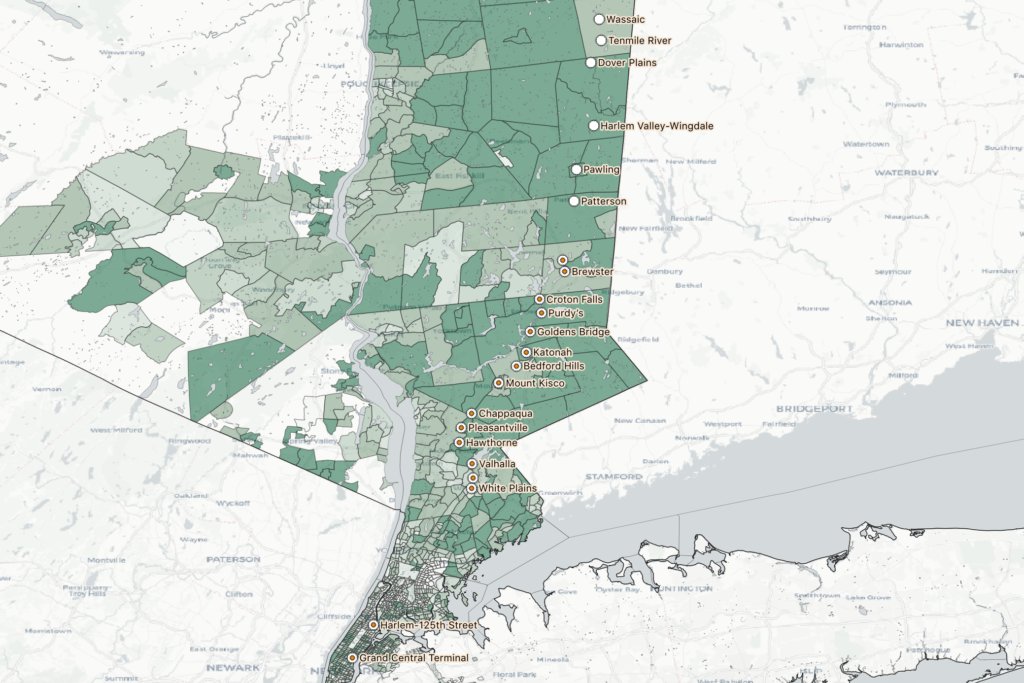
Group 3: Start at Southeast, making all or most stops until either Chappaqua or White Plains, then run express through the Bronx
Group 4: Start at Wassaic, and run express before reaching Southern Westchester
Group 1: from North White Plains to GCT, making local stops in the BronxGroup 2: select stops from Crestwood, express during peak hours (overlaid on Group 1)Group 4: from Wassaic to GCT, express at or before White Plains Group 3: from Southeast to GCT, express from White Plains (overlaid on Group 4, from Wassaic)
The remaining 13 trains of the day generally make very specific, peak-hour stops. Sometimes they stop at only 3 or 4 stations total, and seem to be oriented towards moving people quickly into the city from specific high density areas along the whole line. I was surprised to see that there is actually no single train that makes every single stop — the closest is the 1:56am train from Grand Central to Southeast, which skips 2 stations in the Bronx (these areas are also served by MTA subway stations), and the 6 stops after Southeast (which are generally considered sort of an extension of the “regular” line).
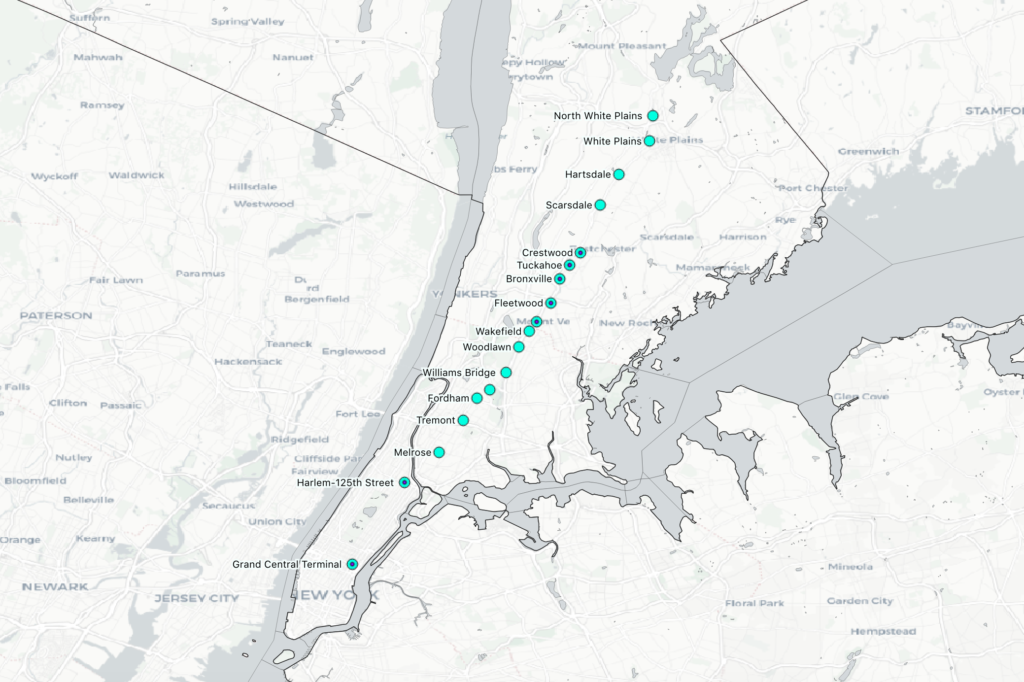
So, most trains make stops north of White Plains or south of it, but not both. Indeed, there are only two southbound trains to “bridge the gap” by making at least 4 stops in northern Westchester AND at least 4 stops in southern Westchester/the Bronx: the 8:14pm from Mt. Kisco, and the 11:21 from Wassaic, which makes many local stops and doesn’t arrive in Grand Central until 1:53am the next day. If there is such a thing as “the nanny train,” as the term seems to have been intended, it’s the 8:14 from Mt. Kisco. Otherwise, anyone commuting from Chappaqua to Woodlawn, for example, has to switch at White Plains from the “Northern Westchester Harlem Line” to the “Southern Westchester/Bronx Harlem Line.”
All groups, displaying “the two Harlem Lines” — note that GCT, Harlem 125th, White Plains, and North White Plains are stops in all 4 groups. I was unable to satisfyingly place these data points in QGIS so that all 4 were visualized at once, so they appear to be only part of groups 3 and 4.
In the end, I’m not very satisfied with my map. To say something meaningful about how train scheduling aligns or is at odds with the demographics of this train line would require a more nuanced visualization of race than just “percentage of white people per census tract,” which is what I have in the background now (see below). To a large degree, it only says what is already widely known: census tracts in northern Westchester generally have a higher percentage of white people than those in southern Westchester and the Bronx. On the train front, likewise, it’s already obvious that White Plains is a change-over station. This makes sense, since it’s about half the distance from GCT to Southeast and is the biggest municipality on the line outside of NYC. I guess I’m a little surprised at just how few trains stop in Northern AND Southern Westchester, but that’s about it in terms of breakthroughs on this map (and I got it mostly from the train schedule, rather than the map).
I know it needs a legend! Groups 3&4, stopping mostly in census tracts with white populations of 70-100%.Groups 1&2, stopping mostly in census tracts with white populations of 0-70%.
The process of making it was extremely enlightening, though. To have spent this many hours only to arrive at a lackluster conclusion and lackluster map is humbling, and helps me understand the pressure to produce results or give in to the temptation to say that our visualizations say what we desperately want them to say. I’m glad to be able to look at this project critically, without any need to make statements (or seek funding…) based on its conclusions.
II. Method
I downloaded American Community Survey 2017 data from the American FactFinder website. I took data for New York, Bronx, Westchester, Putnam, and Dutchess counties, covering every county the Harlem Line MNR services. I took a pre-packaged “Race” dataset that gives a raw count breakdown of race in the generic [super limited] government categories: white, black or African American, American Indian and Alaska Native, Asian, Native Hawaiian and Other Pacific Islander. The raw counts are per census tract.
To display population counts with space factored in, I made the raw counts into percentages. I did this only for the white population, so the map shows the percentages of white and non-white people, with no option for a more specific racial breakdown. This would absolutely be possible based on my dataset, but added too much complexity for me on this project.
I also downloaded a TIGER shapefile package for all census tracts in New York State. I joined this geographical file to my race data file from America FactFInder using the Join function in QGIS. This is done by linking two spreadsheets using a common column that puts the same, unique datapoint in each spreadsheet. This part of the process gave me the most trouble, as QGIS consistently read the same 11-digit number, the GEOid for each census tract, as a string of text in one file and an integer in the other. This seems like a fairly common problem, based on the information available on Stack Exchange and other forums. However, despite numerous attempts to troubleshoot this problem, I wasn’t able to fix it using any of the suggested methods. Instead, I eventually gave up on fixing the problem in QGIS and used Excel’s Text-to-Columns feature to modify my dataset and create a different, common, unique value. This was easily read as a string in QGIS and I was able to join my geography file to my data file.
My favorite part of the data-creation process was using latlong.net to record the point coordinates of all 36 stations on the Harlem Line of MNR. I literally just followed the train line up a digital map and clicked on each station to get its coordinates, then put these into a third spreadsheet. After spending so much time troubleshooting data types in QGIS (and with the problem still unresolved at this point), I took great pleasure in such a straightforward task that also allowed me to explore a bird’s-eye map I am very familiar with from a lived-experience standpoint. I eventually loaded this file into QGIS and was delighted to see every station appear on the map.
Then came the data-creation that felt least scientific and most subject to my own bias and lived experience of this question. I spent many minutes examining the Harlem Line train schedule, trying alternately to pull patterns out and to just allow myself to absorb the schedule without consciously looking for patterns. Once I had counted up and figured out some parameters that seemed reasonable (very much capta, not data), I made each of these groups a layer on my map.
I added labels, fussed endlessly with all the colors and was never satisfied, read about color theory and looked up pre-made ColorBrewer packages, still hated my map and finally called it a day and wrote this blog post. Then I went back and fussed some more after dinner, adding hydrology shapefiles from the state of New York to make my coastline cover the dangling edges of census tracts, and color matching the new water to the underlying knock-off ESRI basemap. And now I’m grudgingly saying goodbye (for now??) to this project at 3 o’clock in the morning so that I can go to sleep and not wake up to it.
The map blog post refers to a project that was created by a four member team in Digital Humanities Methods and Practices last semester. It reached a satisfying level but the mapping section kept being built by me until recently.
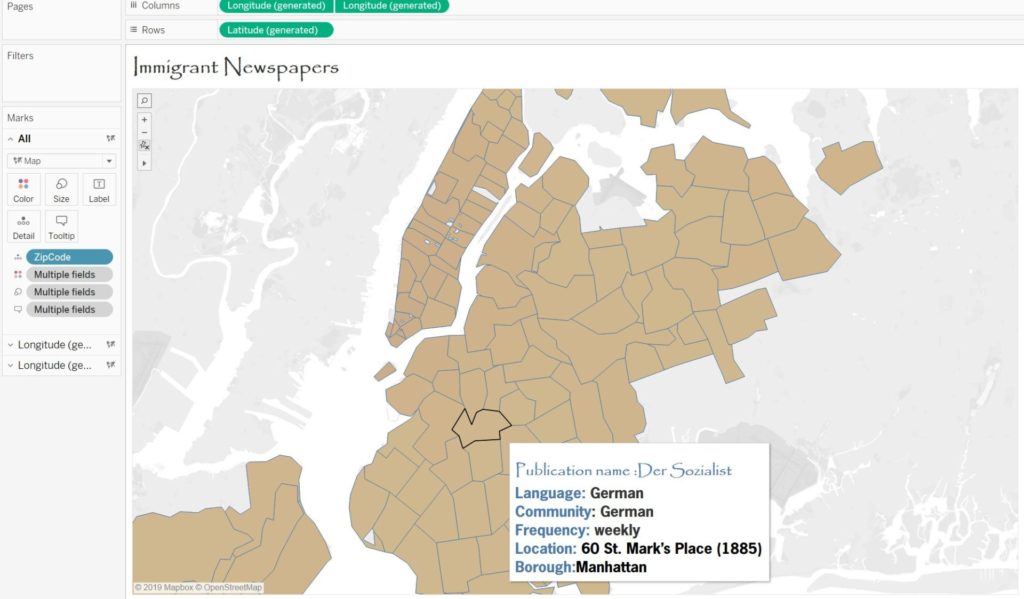
After I completed my course in Digital Humanities Methods and Practices last Spring, I had the chance to work for a project that still has great potential to expand and inform anyone who is interested in immigration ,media history, or in European ancestry and of course every scholar of urban immigration and median history.
Immigrant Newspapers was a project that had multiple tasks as everybody had to get enrolled in a different demand in order to contribute to the completion of it’s initial scope. Our goal was to publish and distribute a digital collection of historical NYC immigrant newspapers by collecting them from hundreds of communities and various ethnic publications and displaying them in a public forum. The time span of those collections was between 1860-1890, mostly because of the increasing diversity of immigrants from southern and eastern Europe who arrived then, but also due to the limited time we had to complete it during our semester.
Because of big responsibilities that everybody had to take over for that project(coding, data aggregating and cleaning, digitizing hard copies data sources, designing, UX researching, logo designing, social media account and many others) we didn’t that the opportunity to finalize our initial goals. Though we managed to take it to a good level. One of my responsibilities was of course to geocode a map so that the user can navigate and be able to easily find the geographic coordinates of those newspapers in the city of New York.
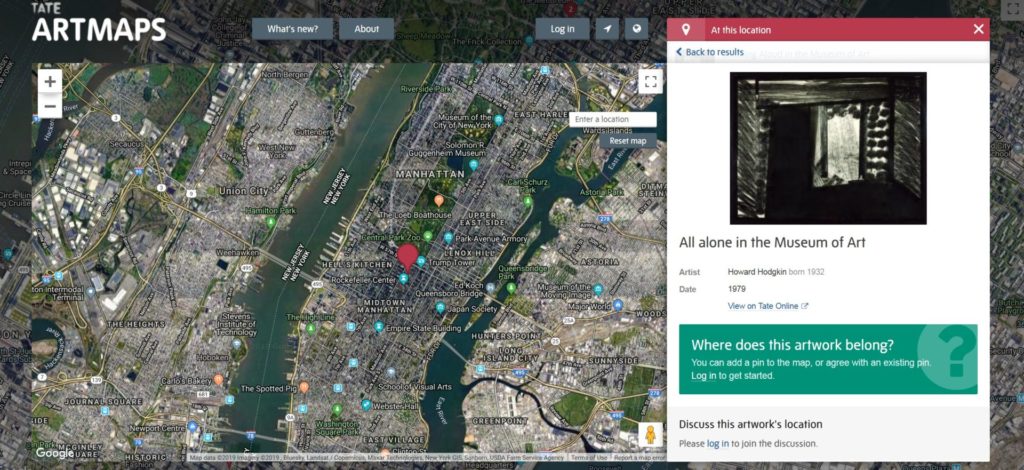
I started building an interactive map through Artmap software. I was inspired by the Tate Gallery in London since there was a similar way to geocode locations. Additionally the design was very appealing as the layout seemed to fit perfectly with the concept of our project.
As I was trying to intergrade my JavaScript
code into the WordPress platform, I faced some compatibility problems. I also noticed
the background of the map was from certain longitude and latitude coordinates
and it couldn’t fit to our demands, as the team and our instructor preferred to
implement a historic atlas of the city. Additionally, trying to change marker
pins with other icons depending on the origin country, I found additional
technical difficulties. So I decided not to use Artmap tool in the end.
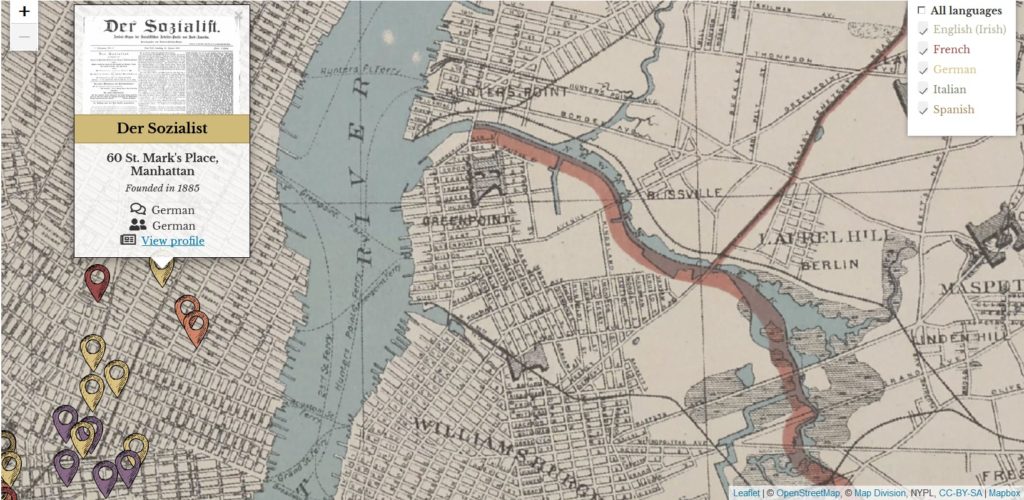
The next step was to find another tool that is more suitable for our project so I decided to use an open-source JavaScript library for mobile-friendly interactive maps called “Leaflet”. Mapbox was the software tool that I used to upload the code that was made through leaflet plugin to proceed with the implementation of the historical map up to the level it has been reached.
The map that was used to present our data was a georeferenced illustration from a New York City Atlas in 1893. The grid covers almost the entire city, and it is good enough to georeference every newspaper what we had in our database. The user can interact with the publications within the context of the New York City region and when he clicks on the pin marker he is able to see valuable information for it’s publication separately.
However, using a historical illustration scanned form New York City Atlas, I realized that it had additional difficulties. Unfortunately the user could see the edges of the page. That could restrict everyone from seeing beyond the boundaries of the page. Additionally using this kind of historical map,I couldn’t set a very high “zoomed out” level and resulted with the same conflict. One of the limited capabilities that I had with this option was that the publications points that were located outside those boundaries should be noted on a tool tip that it would be off the map and that was not looking so professional for such a project. Moreover that was not included among the main user experience principles and as a UX designer should have offered a better solution.
As the mapping project had reached a high level and it could give more efficiency, interaction and value to whom might be interested, I was persuaded that it could also improved ,so I started modify again the mapping code and in order to include more components and useful tools as to add more newspaper ethnicities for example.
What I did this week was to find a higher resolution historical map and to implement it as a background. Along the way I realized that the problem remained the same. My new pin markers I added to the map that were near the edge of the historical map (e.g. a Greek Publication pin near Nassau county , Long Island ) revealed that even that map wasn’t good enough to georeference it, as the user was able to see the edges of the page. So my goal was to try to find another way to create it using filters that could give the historical sense of the map.
Having completed the Datavis Methods class during the summer, I was trying to see if that problem could be resolved using my Tableau skills. I tried to create the map in the Tableau platform .The results were satisfying, the annotations and the pin markers were fantastic but I still couldn’t find a way to incorporate a historical map on it. This is still in process.
The interesting thing is that I managed to change the pin markers I found from shutterstock.com image library. Using different color codes that signifies every different language, I clustered them in a way so the user can recognize the publication newspapers that he is interested in and at the same time can eliminate whatever language the user dislikes to display on the map using the checking filter method.
By clicking on every pin marker the user can find a very detailed tooltip with a sample of the newspaper, any information that we aggregated (location, language etc.) and also a link that goes to the main profile of each publication.
What I have done within the last two weeks was to enrich the map with more newspapers from other languages(Greek, Russian Chezh, Yiddish, Turkish) based on the database that we have already completed .Because of the of time limitation, although we have gathered our data of newspaper titles from Chronicling America, NYPL Microfilm library and NYHS, a project that lasted many weeks, we were unable to prepare all those collections, upload and mapping them at the same time.
My future goal is also to try to geocode all the newspaper collections and also to try to expand their time span as the one that we have done so far was narrowed down to newspapers founded between 1860-1890.
Additionally tools like a search bar could also help the user navigate better. As the collection gets bigger and bigger, information gets gathered and the papers are scattered over the map area, the user could use an advanced search engine tool to seek, locate, define and filter information (text and images) in the searchable index of the platform.
If I should write about the importance to develop such a project I would highlight that this project is a perspective of new immigrant history of New York through the lens of news media. As New York city is a real home for hundreds of communities and ethnic publications, this map could potentially discover great findings in their respective language. Moreover this mapping project could be a reminder of how immigrants have been an integral part of US history and especially in New York City history whether they arrived in 1830 or 2015.
I, like Amanda, had a goal of finding a mapping platform to use for projects at my job. Being the only librarian/archivist on staff, project design (and ensuing work) is all done by me. So I keep an eye out for any free or low cost program with easily accessible tutorials. One project I thought would work well for this assignment was chronicling the history of early 20th century Irish America’s involvement in Irish Independence through a collection in my archive, the Friends of Irish Freedom (F.O.I.F.). And although it is not completely free, I decided to use ArcGIS Online.
Last year, my archive had the exciting opportunity to work on a project about Eamon de Valera’s 1919-1920 trip to the United States. The documentary relied heavily on the F.O.I.F. Collection, an Irish American organization that was formed shortly before the Easter Rising and whose main goal was to assist in any movement that would bring about the national independence of Ireland. De Valera’s tour seemed like a success, with national attention helping him collect $5,000,000 through a bond drive. What actually happened was a clash of politics and personalities that led to the dissolution of the F.O.I.F., a deep division in Irish America, and a decade of court battles for control of the funds raised.
From my research for the documentary, I had some questions that I wanted to begin to answer during the project:
Where exactly did de Valera visit during his 1919-1920 trip?
Did he go to predominantly Irish American states? Is there a correlation between his stops and the Irish American population?
Were Friends of Irish Freedom Branches near each of his stops? Did branches open after his visit?
Where/when was the $5,000,000 collected?
I knew that I was not going to be able to answer all of my questions in the time frame, but I would at least start with his visits and the branches. I initially thought that inputting the data would be the easiest part of this assignment. I had de Valera’s itinerary from the collection, and was going to use ArcGIS Online to create the map. I was also going to add links to photos and newspaper articles that I found online or from the collection. I soon realized that the itinerary I had was not accurate (whether on purpose or changed after he came to New York), so I had to search through the finding aid at UCD of de Valera’s personal papers for dates and then the corresponding newspapers to authenticate it. And to make the search just a little harder, the national newspapers did not fully cover de Valera’s trip. It was mostly covered by local papers (a problem organizers mentioned in both collections). Also, some of the dates that I found in local newspapers or F.O.I.F. circulars were not mentioned in the UCD finding aid. I decided to include all dates with newspaper sources. With time limitations, his tour is only until November 1919 and not until December 1920. Just another reason to always double check your sources!
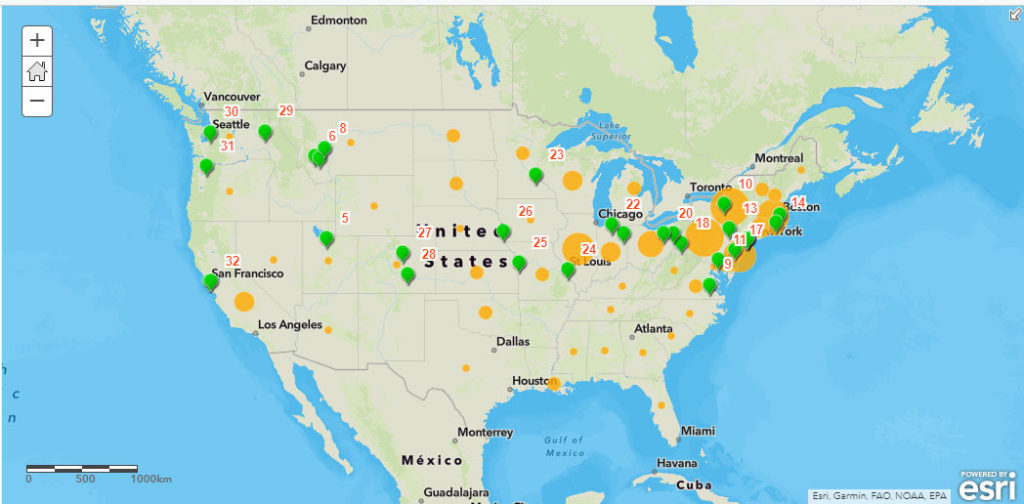
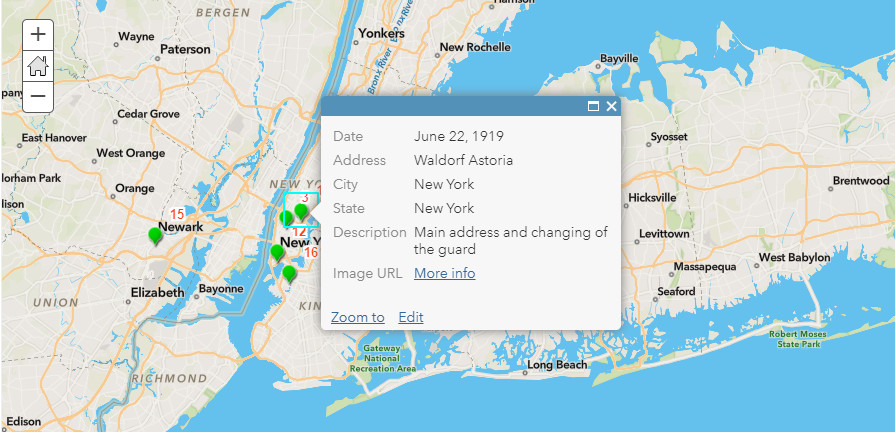
Once I had a good block of data, I created a comma separated value (csv) file from a spreadsheet of the 32 stops. In the file, I included date, city, state, description and image link. Not all stops have all of the fields filled in, but it is something I could go back and add. The csv file was added to my basemap as a layer, and I changed the symbols to green points with orange numbered labels in order of his tour stops. I then configured the pop ups to show the rest of the data from the file. The first stop at the Waldorf Astoria has some text as well as a link to an image of de Valera and Irish American leaders on the hotel’s roof.
The next layer I created was of F.O.I.F. Branches as of September 1920. This information was taken from multiple branch lists in the collection, and put into another spreadsheet later downloaded as a csv file. I used the ‘Counts and Amounts’ option for the data, and the circles in the states increase in size in correlation to the number of branches. I did not put in exact addresses, since there were about 700 of them nationally. I also did not include when the branches were formed since there were so many spread out over several documents. I think in the future I would try to shade the entire state, with the color deepening in relation to the amount of branches, instead of using circles.
Overview of map. From first stop on tour. Image URL is a link to rooftop photo de Valera and leading Irish Americans.
I didn’t want to create a StoryMap since I did not have all of the information I wanted to include, but I did create a slide presentation on ArcGIS Online. Each slide has a title, and I zoomed in and captured an area to show on the slide. The pop ups will appear if you click on the symbol, which is something I had to apply before saving. I also wanted the legend visible on the slides, but you have to click on the legend on the upper right hand corner for it to open up. The presentation is not as nice as StoryMaps, but it did work for the first stage of my project. It is a little clunky and it takes a few seconds for the map to refocus when you move to the next slide.
I really did enjoy using ArcGIS Online, and I think I would use it in the future. I know that it is limited and if I would have used the desktop version or QGIS, I could have added more features to my map before uploading it to ArcGIS Online as mentioned in Finding the Right Tools for Mapping article. What really helped me were the tutorials and videos I found online explaining the way to add layers and special features. For someone who is not technically inclined, they were much needed. I think that if I would have had all of my data (full itinerary, branch information, and population breakdown in 1920), then maybe I would have used the desktop versions first. This is definitely a project I will continue working on, and hopefully I will have a wonderful StoryMap to share in the future.
For our mapping project I created a digital story map and a static map for the first chapter of Warwick Woodlands by Frank Forester. I first created the story map with multiple maps within it and decided to make a map that contained all the locations with the addition of a legend.
The story map feature was something I wanted to utilize for this project because there are many template options and ways to showcase the data. I have used ArcGIS online, to plot points, lines and areas for research before, but never used the platform to house as a standalone site.
I still feel like the site needs major edits, it doesn’t seem complete. I, initially, wanted to geolocate for three to five chapters, but after closer analysis of the first chapter I decided to focus my attention on the initial text and how to best visualize. Something I feel this project is missing is black and white photography and paintings of the landscape, people and places written in the text from that time period. I have hyperlinked a map that covers a majority of the trip taken in the first chapter that was current to the time period, but was not able to find other imagery I was hoping to find, yet. One image, in particular, I was thinking of was a Jasper Cropsey painting, one of his Greenwood Lake landscapes, but for the slideshow effect I wanted to utilize a few images to look over near the end of the chapter. Regarding design, I used a historic map from 1840 for New York City as a base map for the earlier stops along the way, with a gray background to highlight the historic map, other ordinary base maps used were US Topography for the map of Hoboken to Warwick and Newspaper for the map of Warwick. For marks on the map I used simple imagery such as the circle and star and dotted line. The circle points are to describe known locates and the star points for possible locales. The dotted line is to inform the viewer of the approximate path. If there was a known path or known portion of a path, it would be on a straight line. The coloration is due to being the lowest color on the list of colors in the edit function. There is eight color groups for the symbology I was using, so I was thinking about using a different color for each day to designate a different chapter of the book. Something I am finding difficult after publishing the story map is the click-ability of the points – I have found it difficult. In a way it’s the most important aspect of the page, being able to click and read for a particular point. For most of the points, I have added descriptions from the text with the page number it derives from in the novel.
For the static map, I first edited one of the maps in ArcGIS online to encompass all the points created for the first chapter, along with the line to connect all the points and then opened in ArcMap to edit. After other little tweaks, I added a title, and legend with map labels, north arrow, distance, ratio, and a signature.
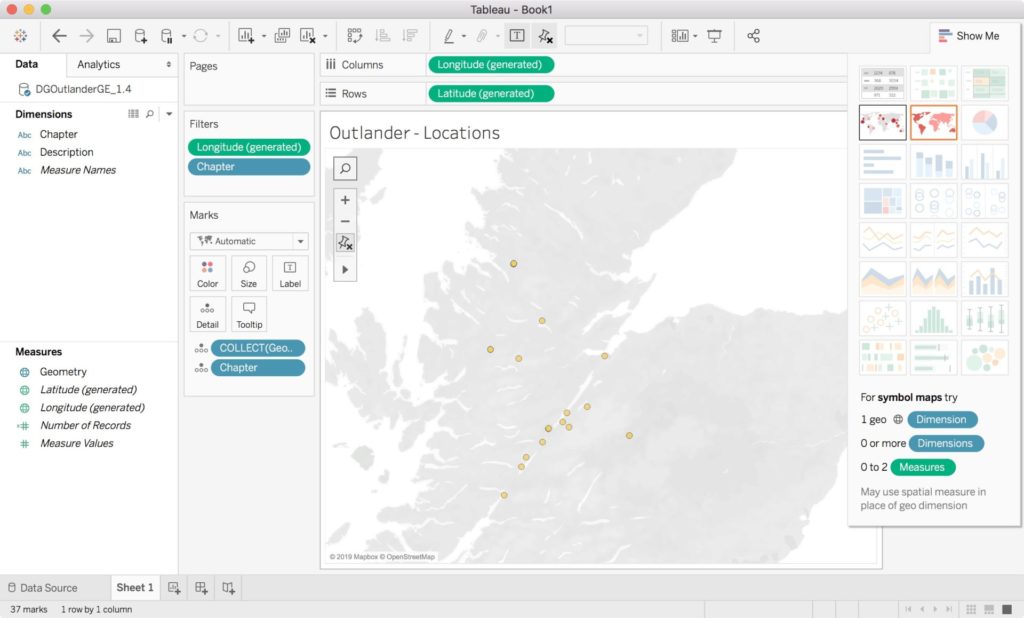
Because my experience working with data is very specific and very limited, the idea of mapping is still rather foreign to me. I approached this assignment primarily from a learning/experimenting perspective, versus setting out a goal to create a complete and polished final product. I was struggling to find the information I would need to map the locations in some of my more recent favorite literary works and decided to focus on an old favorite: The Outlander series by Diana Gabaldon. These are a series of novels (and also now a television series) initially set in 1945 and 1743/44 Scotland. They are classic historical fiction with a significant love story and a surprising amount of time travel. Because Outlander has been a popular series for nearly 30 years, there is a fair amount of analysis and fan work already online. In fact, someone has already created an elaborate map using Google Earth – I discovered this after I was deep into my own work and it was too late to brainstorm a new idea, so I plowed ahead with their data, already created, and imported it into Tableau. Although I successfully imported the geo data in and it appeared on a map, the learning curve was a bit steep for me to figure out how to assign different colors to different locations (for example – five chapters in one location as one color, etc). In other words: I didn’t know how to do what I wanted. I think the data would need to be amended at that point to have more columns than just the description of Chapter/Location and the geographic latitude/longitude data point. Too time consuming for this particular project at this time for me. So I sent myself back to the drawing board despite my hesitancy in starting over.
My first attempt at Tableau, using the Outlander book location data.
I also considered recreating the walking tour by German Traces, NYC/Goethe Institute, but I was eager to create something that does not already exist and would fit into the time frame I had to work and without already knowing how to use these platforms. I felt like a bit of a fish out of water for this assignment and still struggle with the data portion that can even get to the mapping portion. Do you use someone else’s data set (I know this is common and there are tons of open source ones) and manipulate it to fit your needs, or do you create something on your own, perhaps very simple, given the amount of work that goes into creating a data set, and have it be original?
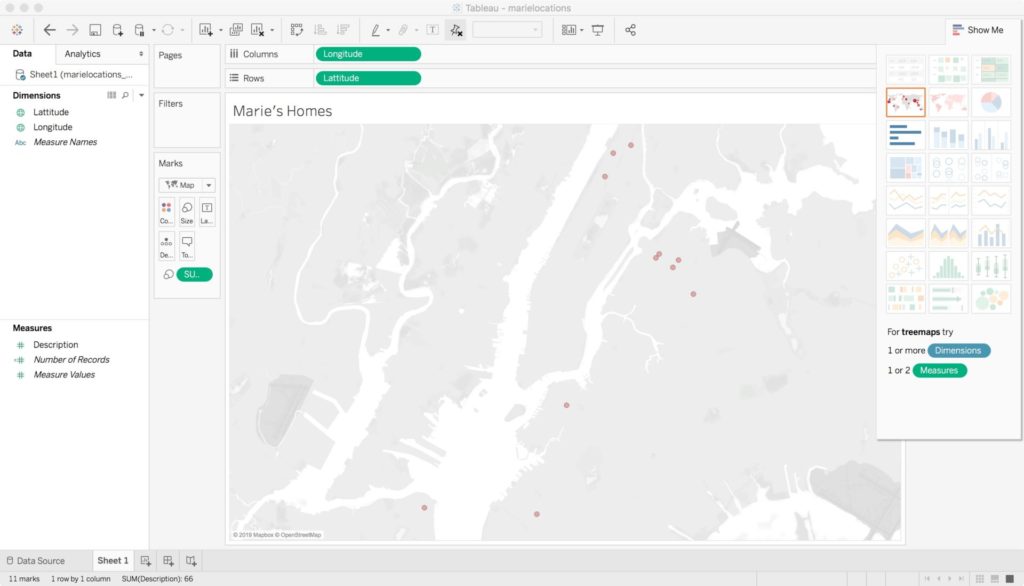
Because I decided to approach this as a learning opportunity, I opted for simple but original. I simply lacked the time necessary to create my own locations data set for a novel, or modify the Outlander one. However, since moving to NYC at the age of 18, I have lived in 12 different apartments in four of the five boroughs. I thought it would be fun to map this.
I used an online tool to get the Longitude/Latitude points for each apartment I have lived in, except for my current one, for some privacy. I used excel to create a sheet with a simple description of 1 through 11 and columns delineating longitude and latitude. I imported this as my data source into Tableau and voila. Although this seems really simple, it was a good learning process for me. I would love to go to a workshop and learn more about using Tableau and some of these other mapping softwares, as I’d love to be able to visualize more interesting data (as I’ve seen some of my classmates do for this assignment!) – but creating my own “data set” and experimenting with importing it, etc. was helpful for me. I am a hands on learner but it would have been more ideal to be walked through a first go, but this was also fun for me. I am eager to delve more into this, especially after our visualization class last week.
Now the big struggle: I used Tableau Desktop and so I do not have a link to share like I thought I would, so here is a screen shot. I was going to share my Tableau Workbook file, but WordPress wouldn’t allow that due to security reasons (so it said).
Marie’s Homes – map
Need help with the Commons?
Email us at [email protected] so we can respond to your questions and requests. Please email from your CUNY email address if possible. Or visit our help site for more information: