I attended a workshop this semester led by Anthony Wheeler about the tool Twine, and I thought I would share incase anyone is interested in exploring over break. Twine is an open-source tool that allows you to create narrative-based stories or games. It requires minimal to no coding skills and is very user-friendly.
It is recommended to download the Twine software on your computer as it makes saving your process easier.
During the workshop, we played a few existing twine games. One was called green eyed monster. It used Shakespeare as the overlaying focus and taught it in a more interesting and interactive way. This game presented a way to make material more stimulating by gamifying it and this also helps make the material more accessible by presenting it in a form students are familiar and interactive with everyday.
Here are the links to the variety of Twine games we played.
arcadim.itch.io/you-a-man-and-a-knife
ianburnette.itch.io/green-eyed-monster
drink-to-destruction.itch.io/date-night
nuha.itch.io/autowrong
awheeler.itch.io/hhyesyp
Toward the end of the workshop we worked to create our own Twine narratives and games. The tool was easy to use and navigate. Twine offers a way to make material more fun and engaging and allows a user to be imaginative in their creation of a game and/or narrative.
For my final project, I proposed the creation of an online resource that collected data related to local NYC cultural institutions that would hopefully make it easier for educators to use local material and collections in their classrooms. Some of my favorite classes and learning experiences from my past involved using material from my local community to understand concepts in more personal and interactive ways. I think this type of resource can help educators engage their students with their surroundings and teach them to care about their communities.
The project’s end result will be a website that contained four elements. The first, a map displaying the location of the various cultural institutions across the city. The second, an information page for each cultural institution mapped. Third, a blog where users and educators can communicate and collaborate. The final element is a repository where users can upload helpful content like lesson plans, teaching guides or example projects. The first iteration of the project will only focus on a select few institutions that concentrate on the history of NYC.
While composing the final project grant, I struggled with creating a project timeline that was achievable within a semester. I have never worked on a digital project from start to finish, so I did not have a good idea of how long aspects of a project usually take. However, I think working through the timeline helped me think about my project more concretely. I realized that I knew some parts were not going to be practicable within a semester, so I pushed those to be included in additional iterations of the project. Additionally, grant writing was a new style for me and I found myself looking over various examples to gain a better understanding of how others have written successful grants. Overall, the experience led me through the process of conceptualizing and proposing a digital project. I learned grant writing is much harder than I believed and creating a project timeline requires much thought and honesty with oneself.
For the text analysis assignment, I initially attempted topic modeling using Mallet, but after many failed attempts, error messages and hair-pulling, I decided to switch gears. I chose to work with Voyant, especially after trying Mallet, because I felt it was the easiest to maneuver and offered a variety of tools for analyzing the data.
My dataset consisted of transcripts from three parliamentary debates that occurred in Britain during the year of 1944. These debates, which took place in March, June and November of that year, discussed three white papers that outlined the government’s policy plans for the creation of a welfare state in Britain. In these debates, Members of Parliament (MPs) discussed the creation of a national health service, employment policy, as well as the establishment of a scheme of social insurance and a system of family allowances.
I chose this dataset because it made up a large portion of the primary source material I used to write my history honors thesis that explored the origins of the British welfare state. For my thesis, I read and analyzed these debates to understand how MPs discussed the establishment of a welfare state and their motivations for its creation. I found the miseries experienced in the aftermath of WWI, the desire to maintain superiority within the world order, and anxieties surrounding the future of the ‘British race’ spurred the call for a welfare state that benefited all Britons. Only through close reading did I discover these motivations and causations.
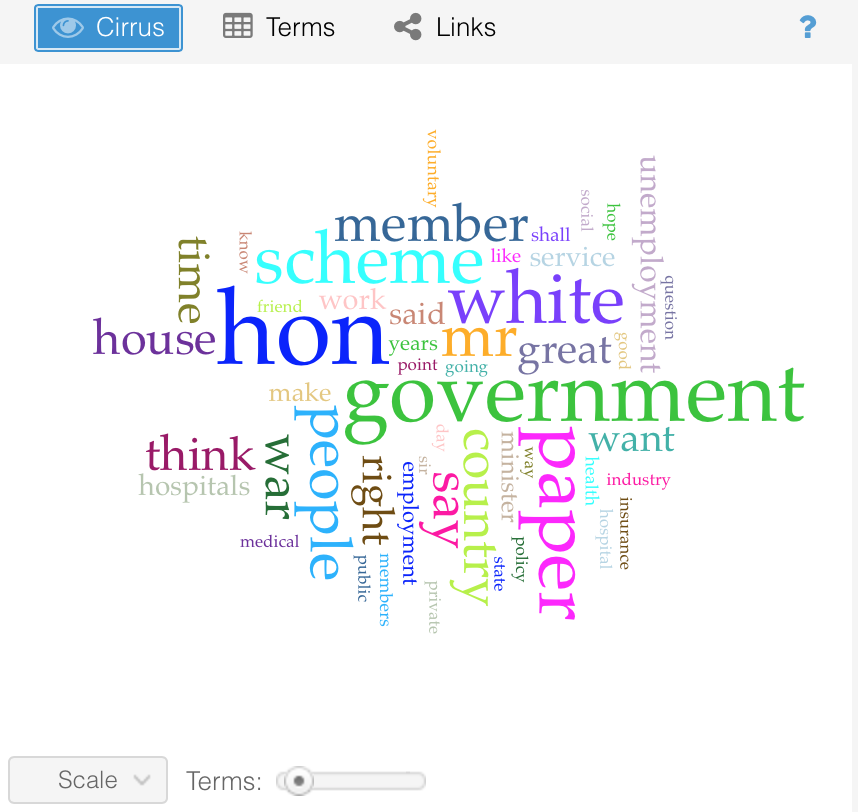
For this assignment, I thought it would be interesting to use Voyant to conduct a distant reading of these debates to see what appeared significant. I started by inserting each debate as a separate document. From the initial output, I saw I needed to add some addition stop words to the automate list. Words like hon, mr and member related to MPs addressing each other in the discussions. The words, white, scheme, paper referred back to the physical documents being discussed. I decided to add these words to the stop-word list because I believed they skewed the results.
Initial word cloud
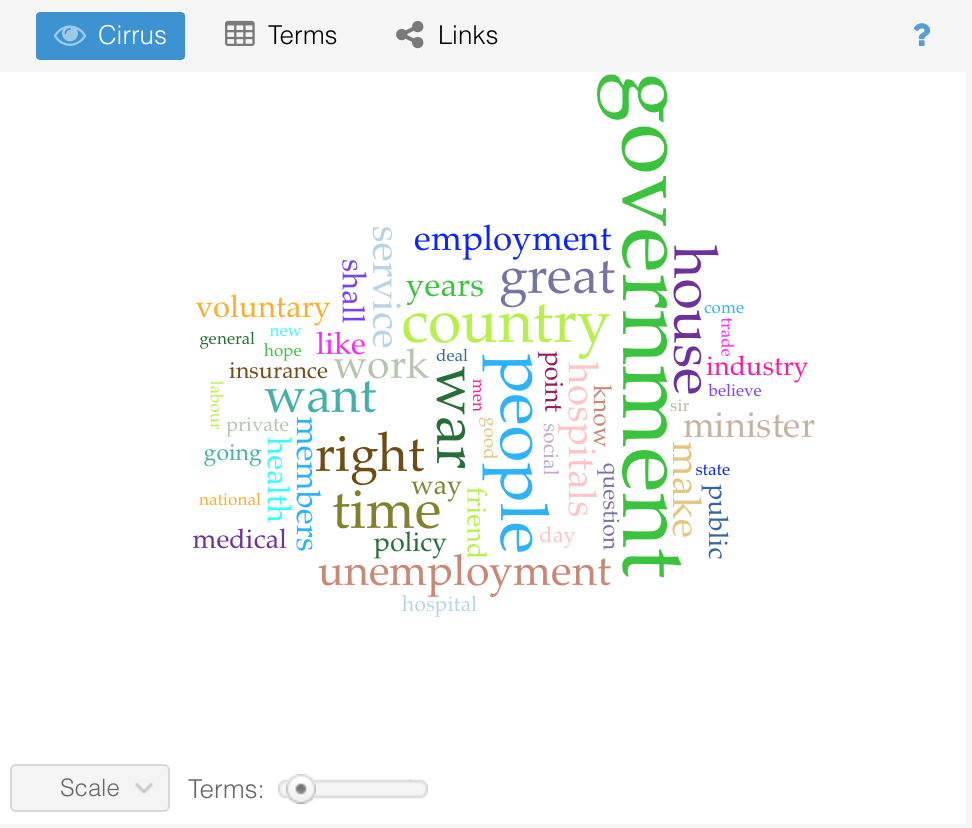
After adding to the stop-word list I reran Voyant to update my results.
Voyant dashboard after second iteration
second word cloud after addition to stop-word list
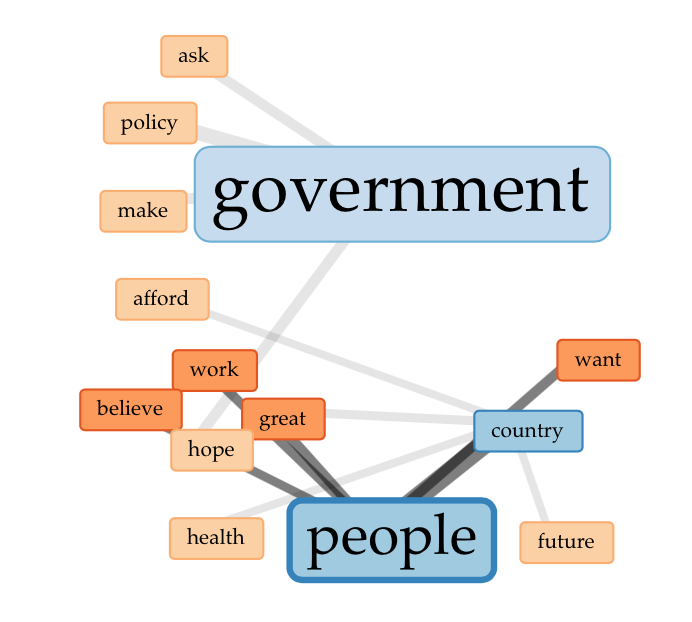
The five words that occurred the most in theses debates were, in order, government, people, country, war and right. These words, to me, were not surprising; they corresponded to the content of the debates. MPs discussed the government’s role in providing welfare to the people, how the country would benefit from its creation and believed it was the right thing to do for the entire population. The word link images below further illustrate word connections within the corpus.
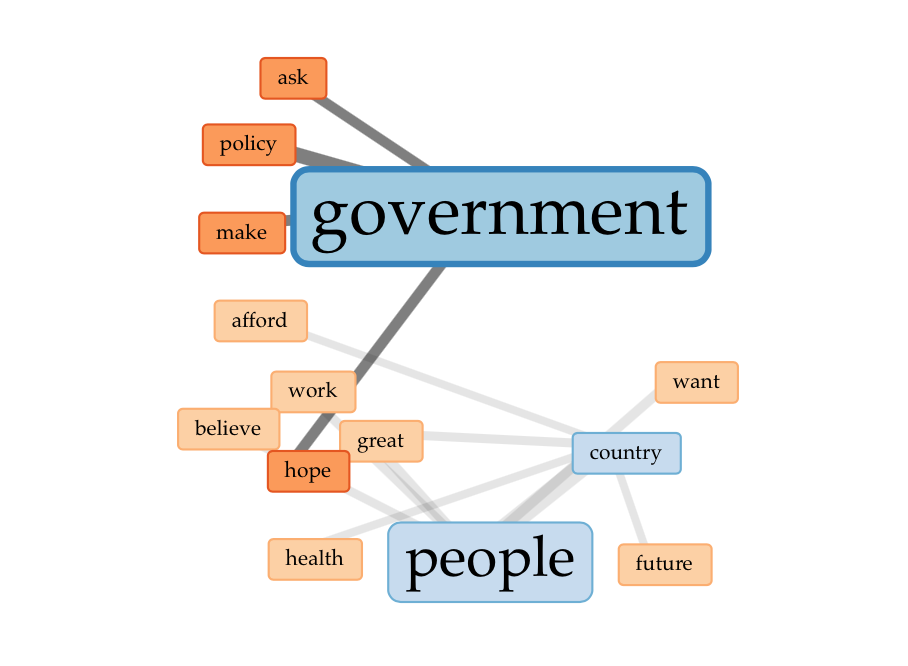
Government links
Country links
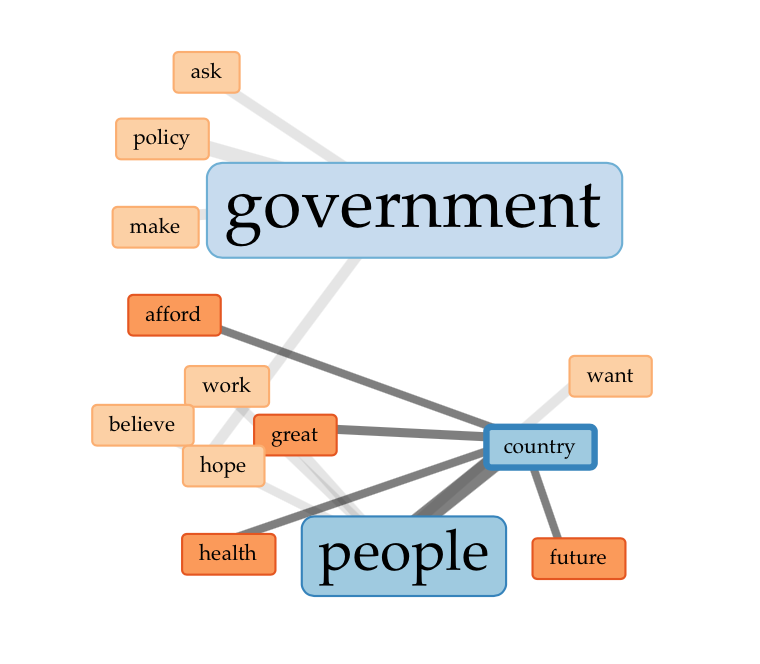
People links
These three images show how the top words government, country and people correspond to other words found within the documents. For someone who has not close read the debates it might be difficult to pull meaning from these connections. From my close reading, these links reflect main points from the corpus: there was great hope in the government’s ability to make policies that addressed the people’s needs and a strong belief that from these policies the country’s future and health would benefit.
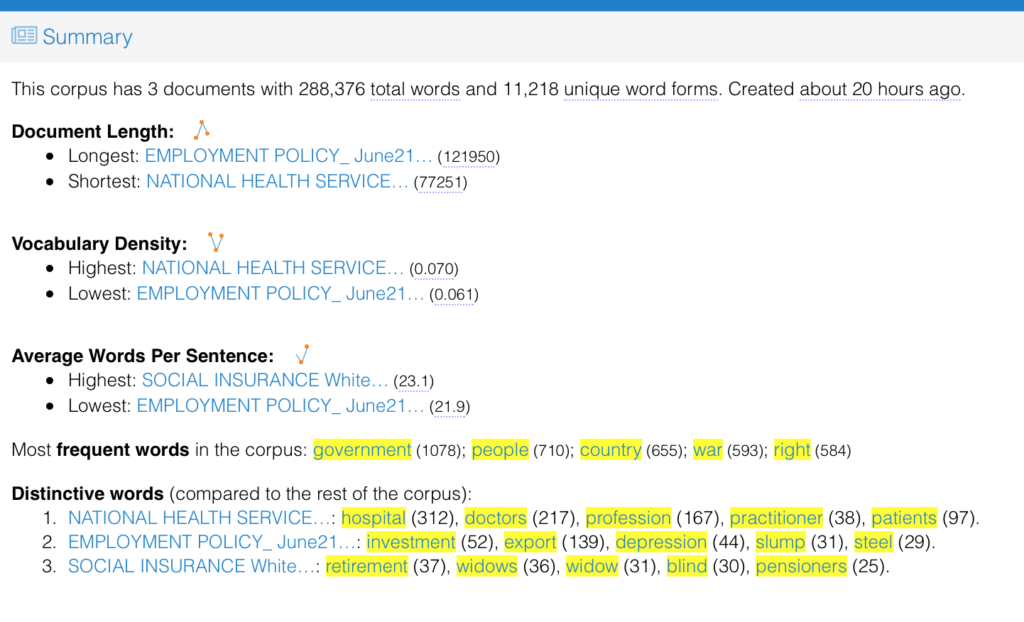
When looking at the summary of the corpus below, the distinctive words within each documents reflect the themes of each. Without knowing the title or topics of each debate, I believe an individual could make an educated guess of what each document details. I think this tool could be useful when trying to determine the contents of a large number of documents within a corpus. Because there are only three documents with rather distinct topics, it is easy to determine the overall contents.
Summary of corpus
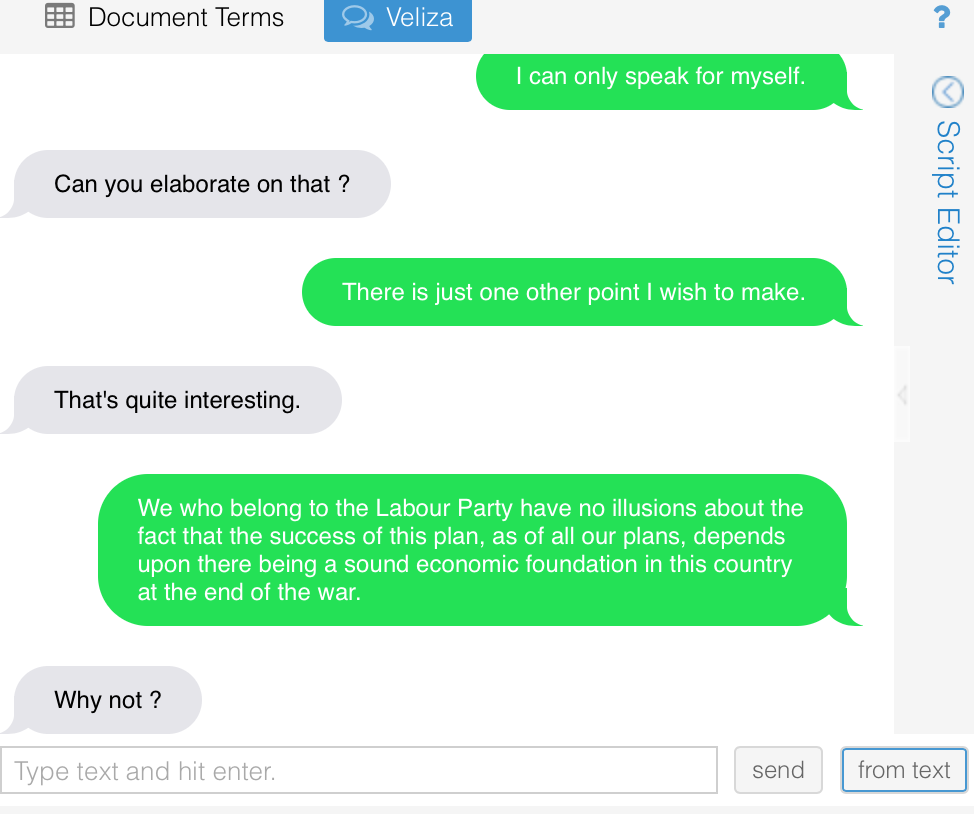
I spent some time exploring the other tools offered through Voyant that aren’t initially displayed on the dashboard. While going through the additional offerings, I found some to be useful toward my data and others that were not. One tool that I found interesting was Veliza. According to the Voyant Help page, “Veliza is a (very) experimental tool for having a (limited) natural language exchange (in English) based on your corpus”. It is inspired by the Eliza computer program that mimics the responses of a Rogerian psychotherapist. I didn’t know the context of either, so after googling I found the basic premise was that the computer program would respond to your text in a way a psychologist typically would.
To start, you can choose between entering your own text, or text from you corpus you wish to discuss, into the text bubble at the bottom to start a conversation. Or you can import text from your corpus by random using the ‘from text’ button. I chose to use the button to randomly enter text to see how the tool would respond. I clicked the ‘from text’ button multiple times to see the variety of responses. Below is a example of a conversation with text from my corpus. Even though this tool is not specifically useful for analyzing data, it was fun to play around and test how Veliza would answer.
Veliza text conversation
Final Thoughts
It is always important to remember the parameters of analysis are set by the researcher when doing any type of text analysis. With my analysis, I chose the documents as well as additional stop-words added to the list. This created a specific environment for exploration. Another individual could do an analysis of these documents and come to very different conclusions based on how they framed the data. I believe my close reading of the documents influenced my distant reading of them. My knowledge of the context gave me a better understanding of the distant reading results. Or one could also say, influenced my understanding of them because I already had preconceived notions. In general, I think distant reading is usually better with a large corpus, allowing for patterns to be discerned over time, but I was excited to see how the data I had spent so much time examining up close would look from afar, so to speak.
Overall, I think Voyant is a good way to get a broad analysis of a corpus or document. With the variety of features available, this tool is helpful when an individual wants to look at the data from multiple directions. Not being limited to only word links or topic modeling allows for wider exploration of a corpus and a higher likelihood that some type of insight will be gleaned from the first iteration of analysis.
In the future, I think it would be an interesting project to look more broadly at British parliamentary debates over time to see if any interesting patterns appear. The website Hansard has the official reports of parliamentary debates dating back 200 years and gives users the option to download debates into a plain text file, making the analysis of these debates with computational tools quite easy.
I have always considered the use of mapping as an interesting way to look at ‘lived experience’ and to learn more about constructed ideas of place within a space. For my mapping project, I took a tiny step toward exploring my own experience while studying abroad in the fall of 2016.
I decided to work with ArcGIS StoryMaps because I had worked with ArcGIS Desktop in the past and was interested to see how the online/public interface worked. I also chose this tool because it allowed me to incorporate other forms of media alongside my map rather easily.
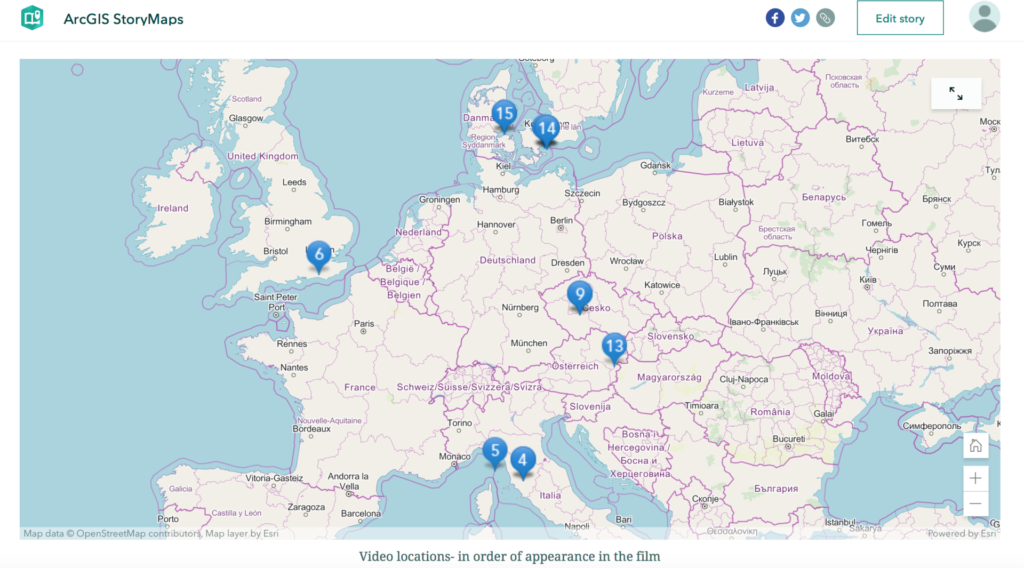
While contemplating what to map I decided to focus on a film I created for a class in my undergraduate career that combined many video clips from my time abroad. This film served as a contained example of what I could do if I wanted to explore my entire abroad experience through my entire collection of photos and videos. For my base map, I chose to use the OpenStreetMap Vector base map because it resembles Apple Maps and Google Maps, both of which I used constantly when traveling abroad. By using the OpenStreetMap, I included an element of my experience that cannot be separated from my pictures and videos.
I started by plotting the exact location of each video clip on the map. I gave each point a number that corresponded to the order the video clip appeared in the film. For example, the first clip is from the rainbow panorama art installation at the Aarhus Art Museum in Aarhus, Denmark. This location is marked with a ‘1’ since it appeared in the film first. I experimented with the labeling of my points. For some, I gave the name of the location where the clip was filmed, for others I gave a descriptive title related to the content of the clip. If I continued working on this map, I think it would be useful to have the exact location of the photo or video along with a description of the content together because it would incorporate a geographical location with my interpretation/feelings/understanding of each location. I believe this to be more compelling when examining an individual’s ‘connection’ to a point in space.
I wanted to feature additional photos I took from the locations of the video clips on the map but I could not figure out a way to upload them without first bringing them online so they could be embedded. To remedy this, I chose to include photos within the storymap using the sidecar feature. I added three photos corresponding to the first three locations presented in the film. In the description box, next to each of the photos I listed a number that corresponds to the numbered location on the map. I also gave the name of the geographical location found on Google maps, as well as the date I visited each location. If I move forward with this project, I think it would be interesting to have each marked location on the map have a sidecar with additional photos of the landscape, photos of items collected from the site like a museum ticket, diary entries, and other media to create a fuller picture of my lived experience.
While working with ArcGIS StoryMaps, I did run into a few issues. Originally, I wanted to upload my film directly to the page but was unable to because it was in .mov format instead of .mp4. I had to embed the link to the film on YouTube to have it appear within my story. Some of my points are close together, so when the map is zoomed out not all points are visible. The scale of the map does not allow all points to be seen within the same frame; I think this diminishes the ability to geographically visualize the film as a whole because not all the locations are displayed. I already mentioned above my issue with adding photos to my map and my solution by using the sidecar feature. While this feature somewhat solves the problem, I think it creates distance between the film, map, and photos, causing them to seem disjointed. Ideally, an individual would see them all together, creating a fuller multimedia experience. By looking at each element separately it is harder to recreate my lived experience and does not allow for a user to explore/view the media together.
In my field of study, I think StoryMaps could be used to explore the lives of historical figures or even specific communities in a more expansive way. This tool allows for the visual exploration of many materials that allude to an individual or community’s perceptions of a place. Additionally, by attempting to create a map that reflects my experiences abroad, I think StoryMaps could be used outside academia as a social platform for displaying a person’s journey/experience/life. I won’t say if this could be good or bad, but it is thought-provoking in terms of social media’s role in the world today.
Before taking this course, I was familiar with how DH has been defined in the past. The introductions I read from the 2012 and 2016 Debates in the Digital Humanities reflected my understanding of DH. The 2019 introduction, however, resonated with me. Digital humanists can come together by “enabling communication across communities and networks, by creating platforms that amplify the voices of those in need of being heard, [and] by pursuing projects that perform the work recovery and resistance.” The sites listed to explore this week follow the line of thinking outlined in this introduction.
I believe the project Torn Apart/Separados is an example of digital humanists contributing to an “informed resistance” mentioned in “Introduction: A DH That Matters.” By mapping and visualizing the financial web that supports and funds ICE, this project attempts to inform the public and bring attention to those affected by federal agency.
Create Caribbean Projects serves to make knowledge free and accessible to all people. They also build and share digital tools that preserve Caribbean culture and heritage. This initiative is an example of DH creating scholarship of a community for its community. These project help boost voices and experiences not typically addressed. It also challenges the epistemology of the Global North as universal, an idea addressed in “Introduction: The Digital Black Atlantic.”
I think DH can create scholarship for, and give voice to, communities threatened by the reality of the world today. I believe DH can be defined as a field that uses a various areas of study and tools to tell complex stories. The two projects mentioned above are examples of this definition of DH in action. In this moment in time, it important to tell the stories of those silenced and the interdisciplinary nature of DH allows for a more expansive effort in telling these stories.
Need help with the Commons?
Email us at [email protected] so we can respond to your questions and requests. Please email from your CUNY email address if possible. Or visit our help site for more information: