Author Archives: Margael St Juste

Looking for Parallels of Imperialism: Manifest Destiny | Generalplan Ost.

For my text analysis project, I decided to build two corpora each based on a political doctrine of imperialism.

 This is the first text analysis project I’ve undertaken so I want to make clear that the goal of this analysis is experimentation. I am not attempting to draw any finite conclusions or make general comparisons about the historical events which give context to these corpora. The goal is to explore the documents for topical parallels and reciprocity of language simply based on the texts; and hopefully have some fun while discovering methods of text analysis. Nonetheless, I am aware that my selection process is entrenched in biases related to my epistemological approach and to my identity politics.

When I began this project, I was thinking broadly about American Imperialism. I was initially building a corpus for exploring the rise of American imperialism chronologically starting with the Northwest Ordinance to modern day military and cultural imperialism through digital media. The scope of the project was simply too massive to undertake for this assignment, so I started thinking more narrowly about Manifest Destiny. I started thinking about the Trail of Tears, and as I did, my mind went back and forth to parallels of the Death Marches in Nazi-Occupied Europe. So I thought; why not build two corpora to reflect the two imperialist doctrines which contextualize these events. Manifest Destiny and Generalplan Ost.

Manifest Destiny Corpus

The following bullet points are the notes that best sum up my selected documents for Manifest Destiny.

  • U.S Imperialist doctrine of rapid territorial expansion from sea to shining sea.
  • Territorial expansion will spread yeoman virtues of agrarian society
  • Romanticization of rugged individualism on the frontier
  • Removal and massacre of inhabitants of desirable lands.
  • Racial superiority over native inhabitants.
  • Territorial expansion is intended by divine Providence.

Generalplan Ost Corpus

The following bullet points are the notes that best sum up my selected documents for Generalplan Ost.

  • German Imperialist doctrine of rapid territorial expansion across Eastern Europe.
  • Territorial expansion will create an enlightened peasantry
  • Romanticization of nationalistic racial purity as patriotism
  • Deportation and genocide of inhabitants of desirable lands.
  • Racial superiority over Jews, Slavs, Roma, and non-Aryans.
  • Territorial expansion is justified by WWI’s illegitimate borders.

Building the corpora

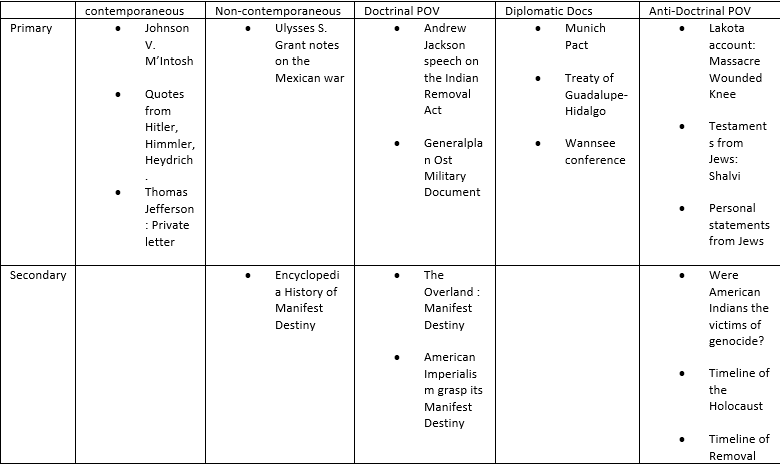
Building the corpora was one of the most time-consuming processes of the analysis.  Prior to selecting my documents, I identified some important criteria that I felt were necessary for a balanced representation of voices. I wanted to incorporate both doctrinal and anti-doctrinal perspectives, both primary and secondary sources, as well as temporal distance in the categories of contemporaneous and non-contemporaneous. I used a triage table to sort documents. Here are a few examples;

Once I had selected ten documents for each corpus, I was faced with what seemed to be the insurmountable task of tidying the data. Several documents were in German. I had all types of file objects, some web-pages, some PDFs, and some digitized scans.  For the digitized scans which were mostly diplomatic documents, I was able to find a digitized text reader from the Yale Law Avalon Project which not only read the texts but translated them from German to English since it already had a matching document in its corpus. For the secondary source German document, I used the “translate this page” web option. I scraped all the web-pages using BeautifulSoup and converted all my documents into plain-text files for both corpora. By the end of my second day on the project, I had created 20 files on which to run some text analysis.

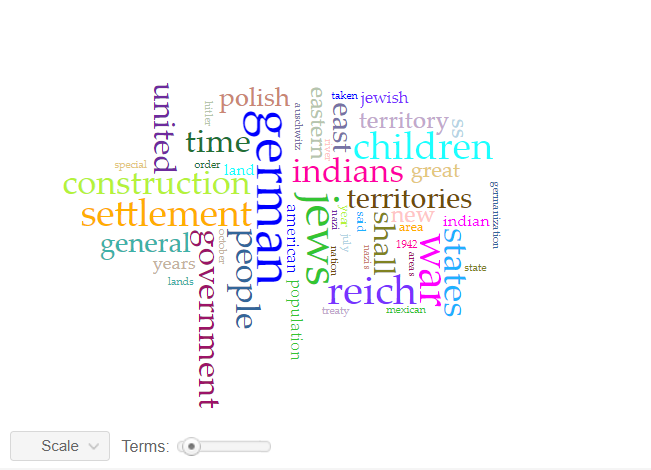
I was a bit nervous about building my own python notebook, so I started working with Voyant.  At first, I uploaded each corpus into Voyant to analyze one by one. Not yet looking for parallels, I wanted to see what a distant reading of the selected documents would look like on their own. And immediately after loading my Generalplan Ost corpus, I was greeted with five mini windows of visualized data. The most remarkable one was the word cloud with terms such as; Reich, German, Jews, 1941 colorfully appearing in large fonts, indicating the lexical density of each term in the corpus. Similarly, with the Manifest Destiny corpus, terms such as; War, Indian, States, Treaty also appeared in a constructed word cloud. I found many interesting visualizations of the lexical content of each corpus, but my goal was to bring the whole thing together and search for parallels in topics and reciprocity in the language.

word cloud from Manifest Destiny and Generalplan Ost corpora

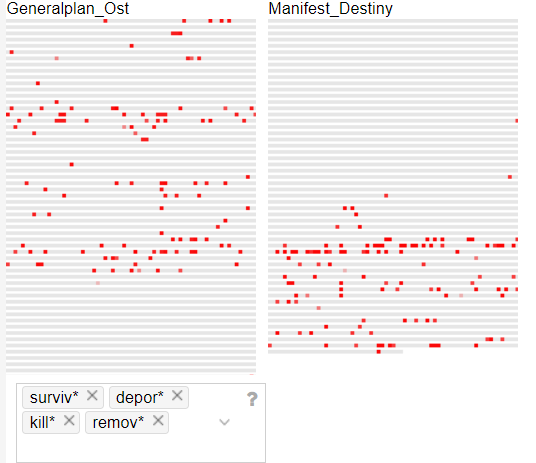
I brought the two corpora together and started digging. One of the best tools I found on Voyant is the MicroSearch tool which displays a selected term in its local occurrence (where it is found) over the entire corpora. It displays lexical density in context as a miniaturization of the original text format and not as an abstract visualization. It is tantamount to geotagging items on a map. You can look at the map and see where each item is located in relation to other items. I found this tool incredibly effective at displaying parallels across corpora. For example, in this MicroSearch capture, I was looking for the terms with the following root words (surviv*, deport*, kill*, remov*) indicated by (*). The MicroSearch returned all instances of all words with the roots I selected wherever they were found. As a result, I was able to visualize a key topical parallel in the corpora; the term removal being frequent in relation to Indian, and the term deportation being frequent in relation to Jewish.

This capture is a MicroSearch of the terms with the following root words (terri*, empi*, imperi*, land*, settl*, colon*, constr*)

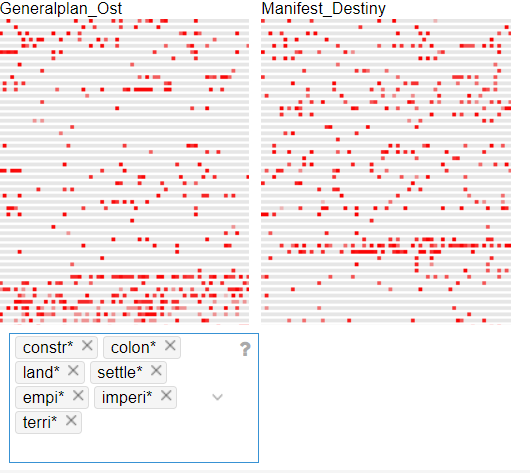
If I were to group these root words into the topic of ‘imperialism’. I could make the case for a topical parallel based on the lexical density and distribution of those terms in the corpora.

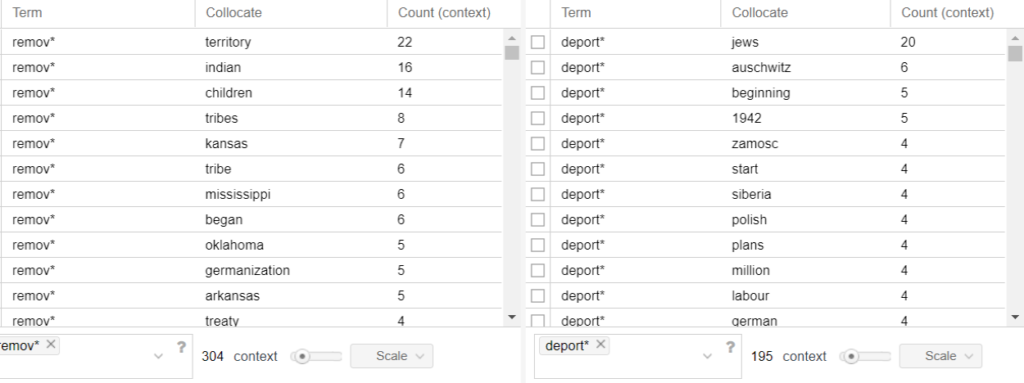
Another tool that I found useful was the collation tool. The collation tool matches words that repeatedly appear next to each other and counts the frequencies at which they occur. Matching two words allows for each word to frame the context of the other and the higher the frequency number, the stronger the relationship is between those words.  For example, in this capture, the term deport* and the term Jews are found together 20 times. Whereas the term remov* and the term Indian occur together 16 times.

The crossing bars in the trend graph represent a reciprocal relationship between the terms Jew: Indian. The term Jew* appears 306 times in the Generalplan Ost corpus which is comprised of 45495 tokens. I can determine the numerical value of its lexical density as follow; 306/45495 = 0.00672601 which in percentage equals 0.673%

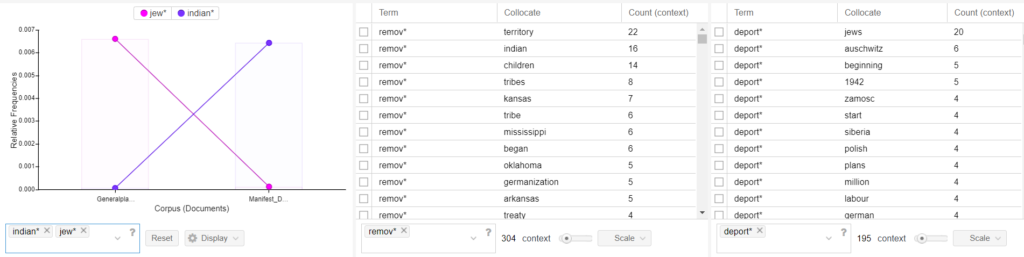
The term Indian* appears 257 times in the Manifest Destiny corpus which is comprised of 39450 tokens. 257/39450 = 0.00651458 which in percentage equals 0.651%.

While I experimented with Voyant, I became aware of the limitations of its tools. And I started to think about building a python notebook. I was hesitant to do so because of my limited use of python and the complicated syntax that easily returns error messages which then takes extra time to solve. Despite my hesitance, I knew there was much more in the corpora to explore and after spending an hour parsing through the notebook with Micki Kaufman, I felt a little empowered to continue working on it. The first hiccup happened in the second line of code. While I was opening my files, I ran into an UnicodeEncode error which was not a problem for a web-based program like Voyant. I had saved my German texts using IBM EBCDIC encoding. I had to go back and save everything as UTF8. It took me reading about a chapter and a half of the NLTK book to figure out that I could not do a text concordance, or a dispersion plot from a file that was not a text.text file. But once I was able to learn from those errors, I was excited at the possibility to discover so much more using python.

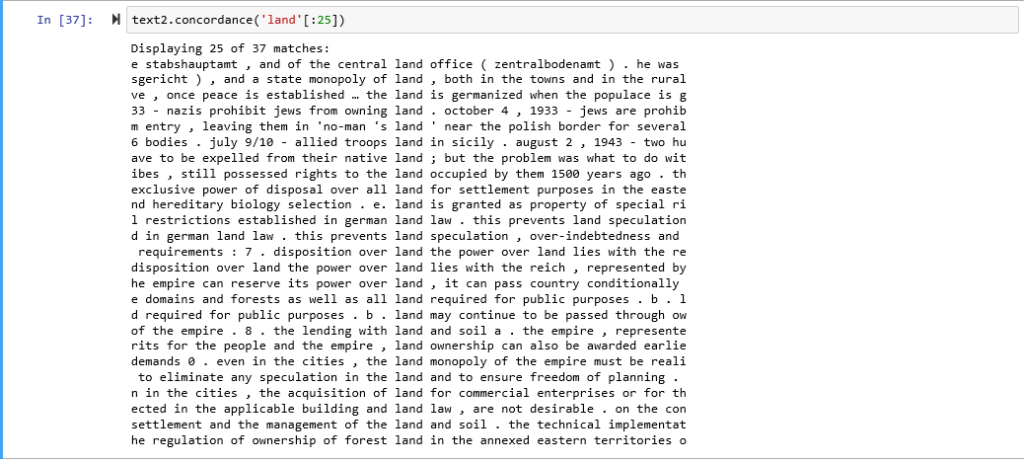
Here I created a concordance with the Generalplan Ost corpus for the word; land

(A text concordance centralizes a selected term within a text excerpt that surrounds it to give context to the term.)

Look at the key words surrounding the word land in this instance.

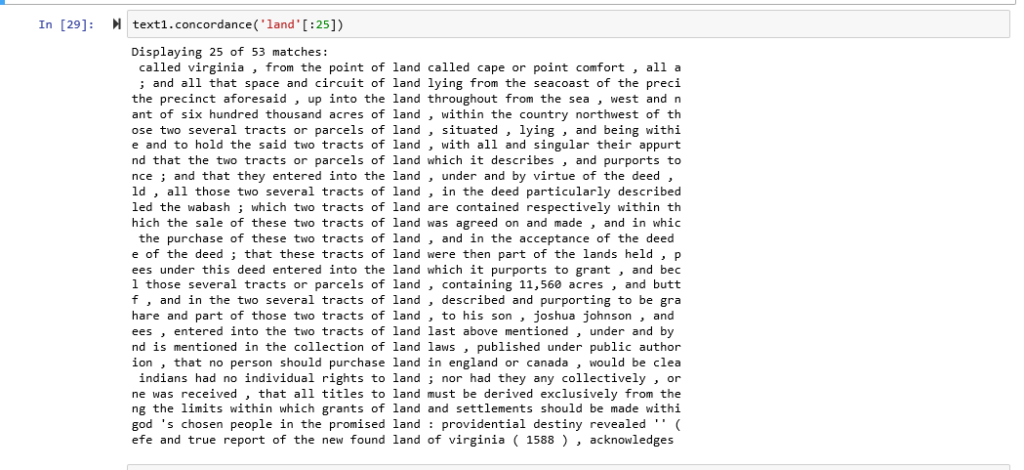
Here I created a concordance with the Manifest Destiny corpus for the word; land

Here I created a dispersion plot with the Generalplan Ost corpus for the words; power: land

this dispersion plot displays the parallel distribution of the words power and land in the corpus.

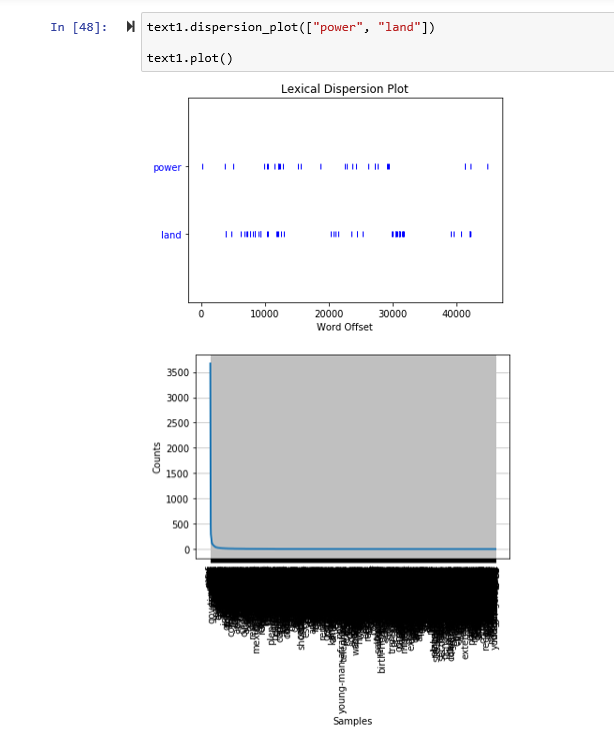
Here I created a dispersion plot with the Manifest Destiny corpus for the words; power: land

this dispersion plot displays the parallel distribution of the words power and land in the corpus.

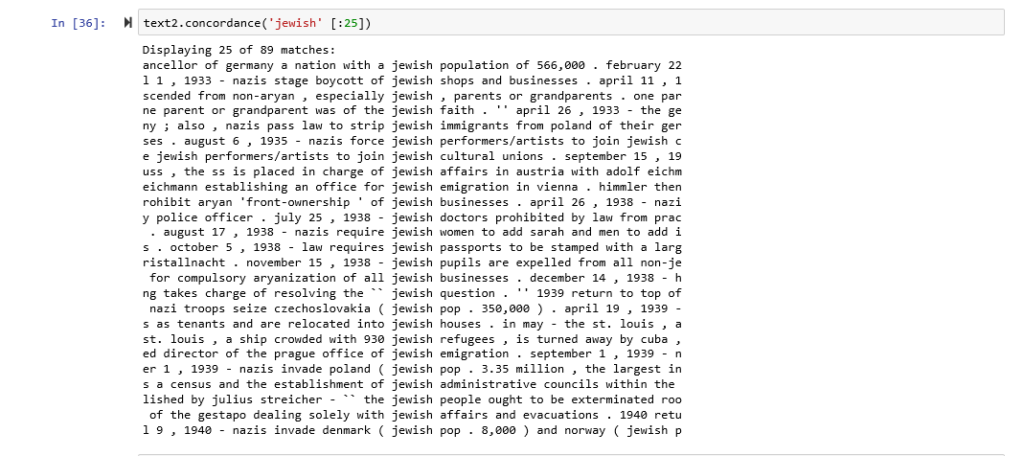
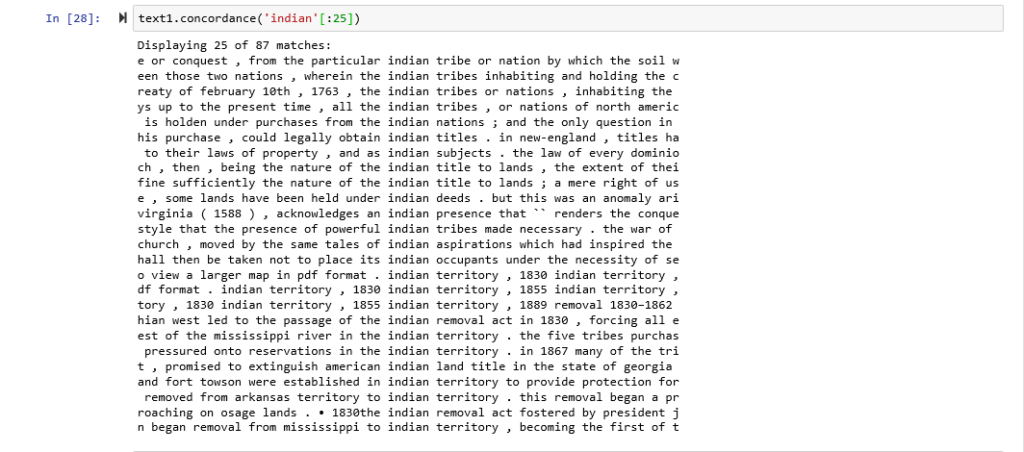
Here are concordances for the terms Jewish: Indian

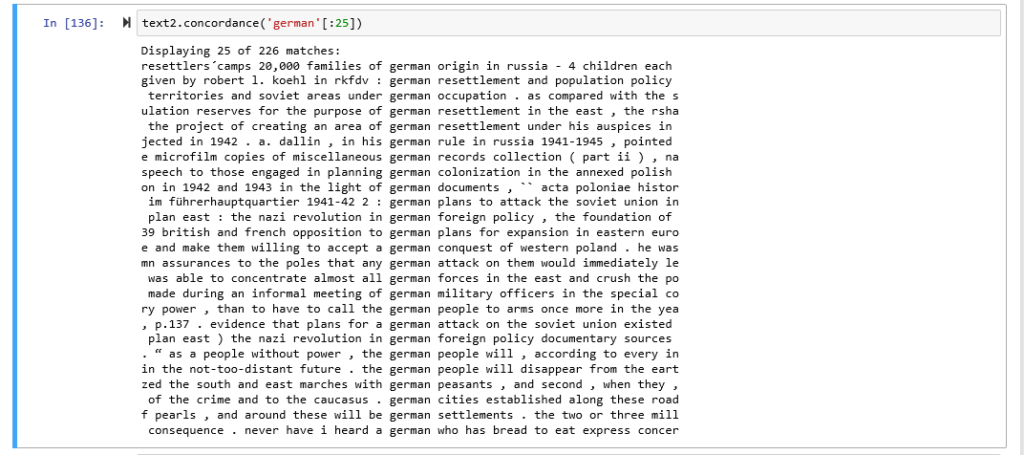
Here are concordances for the terms American: German

Although I can enumerate many parallels in the corpora. There were some distinct differences that I found.

For example, in Voyant, words that appeared in large fonts in the word cloud in the Generalplan Ost corpus such as Reich and German, and to a lesser degree Hitler and Himmler were highly correlated to the doctrinal perspective which makes me think that in spite of my efforts at representing as plural a selection of voices as I could find, the documents I selected for their contextual importance still overwhelmingly represented the doctrinal perspective. In the Manifest Destiny corpus, I noticed that words such as; war, Indian, states, and shall, were the most frequently distributed. I wonder if United States being two words instead of one and being often abbreviated to U.S or America contributed to a lexical density split. In addition, the Manifest Destiny corpus beside having the same number of documents as the Generalplan Ost corpus contained 6, 045 fewer tokens.

Here are some general data from my python notebook

Corpus Total tokens Unique tokens Lexical density % Most unique words
Manifest Destiny 39450 6201 13.80% Indian, treaty, Mexican,
destiny, deed
Generalplan Ost 45945 6216 12.05% Reich, polish, ss,
germanization, 1942

Here are some additional captures from Voyant and python that are also interesting.

this is a frequent distribution list of the top 100 most common tokens in the Generalplan Ost corpus.
this is a frequent distribution list of the top 100 most common tokens in the Manifest Destiny corpus.
this is a dreamscape geospatial visualization of the named places in the corpora.

What I learned from the ITP Skills Lab Workshop

Yesterday I attended the ITP Skills Workshop which took place in the computer lab room 6418. The workshop was led by Ph.D. student Kathryn Mercier. The goal of the workshop was to give general computer users a more in-dept understanding of how their operating system interacts with commands in a shell as opposed to a graphical user interface. Most users interact with their operating systems through GUI (graphical user interface), which is the outer most layer. Users may give commands through the interface by clicking, dragging, scrolling with their computer mouse, by pressing a combination of keys on their keyboard, typing in a search bar, and now by speaking directly to their OS. However, going through the workshop, I now have a better understanding of how to use my computer’s command line interface to accomplish the same goal. The command line interface is essentially a backdoor to tell your computer what to do without interacting directly with the objects you want to work with. You don’t have to click on a file to delete it. You don’t have to open a document to find out how many words it has.

Over the course of two hours, we worked through a 4-part exercise with a file we downloaded. We initially opened Terminal which is the command line interface for iOS, and we located ourselves in the directory using the command; [pwd]. [pwd] is a command which works with Unix operating systems which include iOS LinuX and Git. It unfortunately does not work with Windows so I had to complete my work on a borrowed Mac laptop computer. We then used commands such as [cd directory-name, cd .., cd~], all commands that help users change directory or get to the home directory. Once we are in the desired directory, we can use the command [ls] to list the files. We did a lot of work locating files using those commands using alternating methods such a writing the file path directly [ cd Desktop/Directory/filename].

Once we understood how to move around the directories, we created new directories and edited existing files using commands such as [mkdir directory-name]. We use text editor nano to write the file. Then we repeatedly used [ls] to list the updated directory to check if the file was created and saved.  We used the command [mv] to rename files and move files from one directory to another and [cp] to copy the files.

We did a bit of text analysis using the [cat] [grep] commands and arguments such as [-w] for word [-l] for line [-n] for number [-i] for all cases, and [*] for a wildcard. We ended up writing lines such as

[Grep -w n “The” haiku.txt].  This command returns all lines containing the word “The” and the line number.

Or [ls p*.pdb] this command lists all .pdb files starting with the letter p.

We can do even more analysis by getting the word count for each file using the command [wc], which also returns the number of lines and number of characters as a dataframe. We can save that file separately. we can rearrange our numerical data by order of greatest to least using the [sort] command. Just like a dataframe, we can print the head of the tail by using [head][tail] command.

Overall, this workshop was a great resource to me. Although I had learned a similar concept when I completed The Introduction to GitHub assignment in DataCamp. I felt a lot more comfortable going through this exercise. Perhaps the prior knowledge gave me a boost. However, the in person instruction was helpful and will I be using my command line shell a lot more moving forward.

This is an example of what I did in my Windows ‘s command shell as a demo.

Haiti’s Historical Erasure: A Reflection

(I wanted to contribute my thoughts on Wednesday’s class since I missed the discussion.)

“Haiti at the Digital Crossroads” is a richly layered examination of the modern challenges of archival work in the digital humanities. The author, Marlene Daut places 19th century Haitian historical narratives at the center of her argument and uses the summoning of Papa Legba, the gatekeeper of the archives, as an overture to one of the most the traditional epistemological frameworks for Haitian scholars, Vodou.

The text does not go deeply into the revolutionary history or the emblematic ‘image problem’ Haiti faces but is resonant in significant ways. For many people outside of Haiti, this piece is their introduction to figures such as Toussaint Louverture, Jean-Jacques Dessalines, and Henri Christophe recurring as more than honorable mentions in a discussion about archives and history. For the better part of two centuries, the Haitian Revolution has been a footnote in 19th century discourse. It is only ever brought up to reassign the modern political instability in Haiti into a direct and continuous line of violence to the revolution of 1804; or to pontificate about the ‘lack of progress’ that has been achieved since. Daut’s text is conscious of those facts and still carefully avoids over explaining the importance of the revolution and its cascading effects for black self-determination. However, the context is clear. The Haitian Revolution has never ceased to be a question mark to the powers that be, never mind the short-lived men who accomplished it. So why would these men or the revolution they waged be highlighted in any history books?

Vodou As an Epistemological Framework

The use of Vodou as an epistemological framework which creates alternative paths between the world of the living and that of the dead is a useful approach for archival work which seeks to understand a history that was often not preserved in text but by the memory of the dead we now wish to study. Vodou as a religious philosophy is irreconcilable with western religious traditions that inform western epistemologies. Unlike Christians who devote their earthly existence to the eventuality of eternal life, vodouissants have a sacred relationship with death and spend their entire life preparing for this important transition by honoring a relationship with their departed ancestors through ritual practice. Accessing an archive through vodou means understanding that the dead is itself a source of knowledge. One must acquire a profound understanding of how the dead communicates with the living and how the living can call out to the dead, not just by looking at archives but through other phenomenological pathways such as summoning of a Lwa Papa Legba.

Erasure and Inaccessibility in The Archives

In the context of a republic born out of a colonial history of slavery and to a large degree controlled by the interests of American imperialism since the 19th century, there are significant challenges with the archives, the foremost being, erasure and inaccessibility.

Haitians, much like American descendants of slaves live with the trauma of ritual erasure, not just in the archives of text and artifacts by in commerative and historical spaces. The positive promotion of slaveholders in our public commemorative spaces intentionally divorced from the memory of slavery is an act of historical erasure and a moment of ritual erasure for the descendants of slaves every time they are forced to endure the denial of their history in their own public spaces. I once had such a moment myself when I visited historical places in France for the first time. I remember walking through the hall of mirrors at Versailles and experiencing a moment of ritual erasure. Seeing the gluttonous display of wealth made me sick to my stomach, understanding that at the time that Louis XIV – Louis XVI built this palace and its grounds, It was on the backs of slaves in St. Domingue working on the sugar cane plantations and dying by the hundreds doing so. The erasure of my ancestors was in plain sight yet no other tourist around me seemed to have a clue about the ugly history that yielded these gaudy jewel-encrusted halls. Much like Daut reveals about France’s intentional erasure of Haiti from its history in the rejection of Nemours Histoire Militaire de la Guerre d’Indépendance de Saint-Domingue when “…the French government did not think these materials actually pertained to France”

For digital humanists to address erasure in historical narratives, they must rethink how they approach the archives and be willing to find pathways outside of the archives. Daut points out that one of the prongs in the erasure problem is the fact that; the Haitian people have not been in charge of their narrative; and the sources that have traditionally spoken for them have often come from non-Haitian spaces. Digital humanists must look at the archives differently to center Haitian narratives from Haitian spaces and invest in the work of Haitian scholars.  For example, the Revue de la Société Haïtienne d’Histoire, de Géographie et de Géologie is a Haitian journal that has been regularly published since 1925 yet is rarely used as an authoritative source outside of Haiti. The designation of what is and what isn’t an authoritative source is an important aspect of how Haiti’s erasure persists in western epistemologies. Many times in the text, scholars point out that Haiti doesn’t have a complete history written by Haitian historians, implicating that a written history is more authoritative than the one uniquely preserved through vodou and other traditional epistemologies – falsely leading to the conclusion that Haiti has a poor record of its history.

Although it is understandable that for the purpose of archival work, accessibility to material history such as text and artifacts is important for the construction of the historical narrative of any country. And the lack of accessibility to Haiti’s material history is an archival problem that Haitian humanists must work together to solve in the spirit of Jacques Roumain’s work. In Haiti, there is an idea of collaborative togetherness called konbit that we love to preach but rarely practice. And it is the responsibility of Haitians scholars to actualize this idea in the work of rehabilitating Haiti’s historical narrative.

Toussaint Louverture, Haiti’s founding father, who died in captivity in Fort-de-Joux, France said this as he was captured, and I think it is apt to repeat here in the context of Haiti’s “bad press” as Daut puts it.

 « En me renversant, ils n’ont abattu que le tronc de l’arbre de la liberté des noirs. It repoussera par ces racines parce qu’elles sont profondes et nombreuses. » Toussaint Louverture

Translation…

“In overthrowing me, you have done no more than cut down the trunk of the tree of the black liberty. It will spring back from the roots, for they are numerous and deep.” Toussaint Louverture.

Local Links In A Global Chain

For my mapping assignment, I wanted to create a digital map of a ‘big problem, big solution’ topic. I set the widest parameters for my topic option while limiting my visualization options. I wanted my visualization to cover the globe or as much of it as possible and re-examine mapping from the standpoint of geospatial representation of place, identifiable by a coordinate pair of longitude and latitude. In my map, I sought to explore how global positioning is correlated to attainment in global development, how each country’s national development is always under the sphere of influence of local and global powers, why the notions of global north and global south exist, and how those representations can be harmful or helpful to developing nations.

I landed on the ‘big problem, big solution’ issue of sustainable energy development where in the developing world measurable steps have been taken toward success in contrast to the developed world. I created a map of the inventory of global wind masts and solar stations from which there is access to measurement data. I gathered this data from 4 World Bank studies from 2012-2018. My interest in looking at this issue was very different from the organization who published these studies and the project funders attached to them.

The World Bank states that their interests in conducting these studies. “…aims to help improve developing countries’ knowledge and awareness of solar and wind resources.” The World Bank’s framing fails to point out that although these resources exist within the local borders of developing countries, the manufacturing of solar and wind energy is often controlled by global financial entities therefore making sustainable energy development in the global south interconnected with the policymaking and financial intervention of the global north. The reverse is also true. environmental pollution in the global north is interconnected with human development indices in the global south.

In terms of visualization, I developed my map through 4 layers of data. I decided to represent each inventory through a different color and symbol. The wind masts global inventory is represented in pink in the shape of a meteorological tower. The representation of each symbol is also determined by the size of each local inventory. For the solar global inventory, I assigned a blue flag in the size of each local inventory.

This map displays inventory of global wind masts in 2012
this map displays inventory of global solar stations 2018

The third map aggregated both solar and wind inventories. There is clear evidence that project funders such as ESMAP who principally work to implement the UN Sustainable Development Goal 7 decided to focus on the same geographical spheres of influence with the exception of Armenia getting added to the solar inventory.

I also created a visualization option for the map to display pools of sustainable energy projects as opposed to individual projects.

Global Wind Mast inventory displayed as aggregated centers as opposed to individual projects
Global Solar Stations inventory displayed as aggregated center as opposed to individual projects

The map also has a dynamic function which can display individual local inventory acquisition over time from the first inventory acquired to the last. This feature can only be accessed through the map page.

This map represents many things that I haven’t fully examined but in the most basic ways it answers our question about global positioning and its correlation to indices of human development. Sometimes global positioning means an absolute advantage in a natural resource such as solar energy development because a country is located near the equator. And mobilizing that particular resource whether for trade or other national interest is always interconnected to the influence of other powers which is why the same countries are the duplicate focus of both solar and wind energy development by global financial interests.

No Visualization Without Representation!

Searching for new forms of representation through visualization generates an entire new discussion in the digital humanities about how standard representational tools through visualization are insufficient and even harmful to the complexities present in analytical studies. We needed to ask ourselves, what is data? How are we representing it? And what effect does what we choose to represent and what we neglect to represent have on the processes of knowledge creation and consumption?

We first start by unpacking data. Johanna Drucker leads us through a reconceptualization of data as capta. As a humanist, this notion might be intuitive, perhaps, never articulated in this way before but you have a sense that you always knew this to be true. The fact is; data collection is a selective process, taken not given. Under this premise, historians are trained to be initially skeptical of all data and to investigate all possible factors that surround a dataset (documents, artifacts, human remains). Through this methodological approach, data collection becomes a multi-layered selective process – natural selection of surviving material objects, artificial selection by historical preservation, and the final selection made by the historian for further analysis.

Once we have our data as capta, how do we represent it visually? Therein lies the question at the heart of this conversation. There are many representational concerns that arise. What features of the data do we represent? When we centralize a feature, does it have a trivializing effect on other features?  How are western epistemological frameworks unsuitable for the representation of indigenous cultures? And how do we make visualization more dynamic to represent temporality and spatiality?

Joseph Stalin is often credited with the statement “A single death is a tragedy; a million death is statistics”. This quote really puts into focus the value of holistic representation. Stalin who is arguably the most murderous political leader of the 20th century with an estimate of 14-20 million people killed as a result of his policies, understood how visualization decontextualized from representation was a useful scheme for the implementation of bolshevism in the Soviet Union. Lev Manovich has an argument to make on the practices of information visualization (infovis), a field which has continuously relied on graphical primitive substitutions (dots, dashes, lines,  curves, geometric shapes) for data objects (people, animals, places, material objects, complex ideas) divorced from any substantive representation. For example, replacing a firefighter with a dot on a scatter plot, eliminates all elements but the singularity of his/her/their person. It does not distinguish him/her/them from the 1st grader on the same scatter plot. Graphical primitives gives us nothing of value to contextualize quantitative information other than visual add-ons such as color or size. Graphical primitives are the tip of the iceberg, an optical fallacy that leads us to make incorrect or incomplete assumptions about the data object which is harmful when it has a direct hand in policy making. Direct visualization uses techniques such as miniaturization, tag, cloud, and indexing, which reduce but also preserve the original form of the data object by presenting small or shorthand versions of the original object.

Standard visualization practices are harmful when one epistemology assumes authority over knowledge processes that belong to other epistemologies. Indigenous data and artifacts removed to and created within the traditional western epistemological framework are intractably situated in what Amy LoneTree calls a ‘Difficult Heritage’—meaningful but interpretively problematic. Non-indigenous processes are by design problematic for the study of Indigenous people. They are rooted in the same historical paradigms that legitimizes the ideal of manifest destiny (indigenous land grab) as American exceptionalism and lionizes Andrew Jackson the architect of the Trail of Tears as Old Hickory. The right system for approaching studies of indigenous communities is substantively irreconcilable with the former. Digital humanists today must reconceptualize their entire methodological and theoretical approach to studying indigenous communities. Firstly, it is imperative that indigenous voices are framing the ‘what’ how’ and ‘why’ of knowledge creation as well as curating access to material around their sensitivities and not that of the West.

Visualization is also confronting the representation of temporality and spatiality. The primacy and immediacy of space as the favored medium of graphical and textual representation is a challenge for digital humanists who want to err from that path. Space is a useful medium for arranging objects and ideas in a way that declares certainty, rationality, and finality, a false premise to begin with once we understand data as capta. Moreover, spatial delineation is harmful especially when it forces analysis into binary categories of representation such as gender.  

My Introduction to Digital Humanities

My introduction to the Digital Humanities this week came with several challenges particularly given that I have never before explored this area of study. I found the digital language at times prohibitive if not sufficiently accompanied by the humanist language that I know to decode well.  In fact, it is the field-specific language of Digital Humanities scholarship that I have taken away the most from this initial exploration. Once I started the process of internalizing the language that was essential to understanding the work, I could then approach the work with my now built-in humanist lens.

               Going back in time, I looked at the DH debates from 2012 onward that have continued to shape the field. It was an imperative undertaking to shaping my own understanding of the field’s current position and mission statement in relations to the adjacent disciplines. The Digital Humanities are no longer existentially ambivalent on the question of “big tent” or “chain link” structural models as they once were. Nor are they narrowly excluding “reading and writing” work for the sake of “building and making” work. It is not in the self-interest of the field to set artificial parameters around admissibility when it is not yet a self-sustaining field. It borrows heavily in content, method, perspective, and framework from other fields. Yet it is in its own way an essential puzzle piece of the inter-disciplinary web of the 21st century. It has successfully made the claim for its purpose as a discipline which straddles in-between spaces in traditional humanistic and computational methodologies.

               That much was evident in the scope of the projects I examined. Two projects in particularly captured my interest because of their striking juxtaposition within the field; the Torn Apart/Separados and in The Early Caribbean Digital Archives. The substance of each project greatly differed from the other and the tools of assembly greatly differed as well, although equally relevant to the question of what type of work Digital Humanists should be creating. Each is framed within a political context.  The Separados’ Data visualization is an act of “exposing” the entrenched relationship between the political establishment, the private sector, and Immigration Enforcement and tracking that relationship in terms of political contributions and contracts overtime. The data is shocking, especially as a graphical representation, even more so if you come with stereotypical assumptions about how Hispanics as a political group behave in relation to ICE. As an extension to the project DHers might want to visualize the political influence of corporate contributions by looking at congressional voting records on immigration legislation and to determine a correlation if any between the amount of contributions received from contractors and  PACs supporting ICE and the number of YES/NO votes on immigration measures.

               A political agenda is equally embedded in the Early Caribbean Digital Archives. The overlaying of text and images as an act of “positive revisionism” counters a narrative often presented from the European colonialist perspective. The work of reclaiming the Black Narrative has its roots in the work of W.E.B. Dubois who first labored on the question of the history of the Negro Race after he was told repeatedly by white academia that they didn’t have one. Reclaiming the Narrative is an ongoing process with contributors over many generations and therefore carries with it an intellectual imperative for black scholars unlike many other works. The political aspect of the Early Caribbean Digital Archives lay  both in “reinterpreting the text and contextualizing it with images”,  as well as using new technological tools to make it accessible to the audience for whom it really will make a significant difference, history classrooms across the country.

               Although I found the projects to be vastly different in substance, both being presented on the same digital platform creates a narrative among the works to be viewed and interpreted in relation to each other. I did not look at either project in a vacuum. I went back and forth to their shared digital home to compare and contrast what I observed about them. I got to thinking about what audiences they were intended for and whether the authors had anything to say to each other.  Whether they are isolated links in the Digital Humanities chain or is there opportunity for “crossing” and can we use the “memory” of historical events to contextualize contemporary political danger? I am still making new observations and learning significantly about the Digital Humanities, now that I found my entry point.