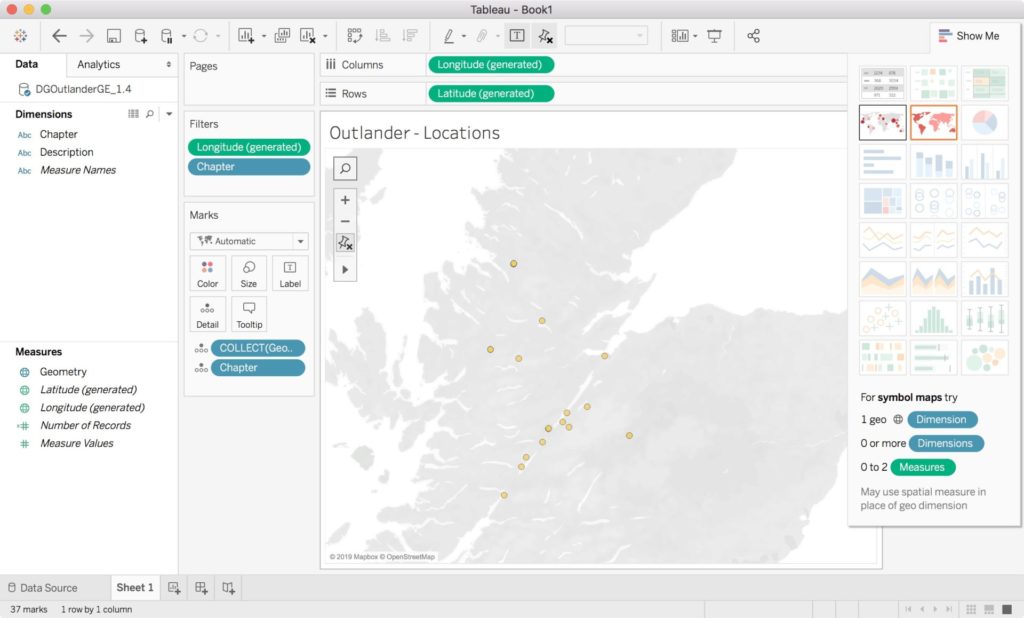
Because my experience working with data is very specific and very limited, the idea of mapping is still rather foreign to me. I approached this assignment primarily from a learning/experimenting perspective, versus setting out a goal to create a complete and polished final product. I was struggling to find the information I would need to map the locations in some of my more recent favorite literary works and decided to focus on an old favorite: The Outlander series by Diana Gabaldon. These are a series of novels (and also now a television series) initially set in 1945 and 1743/44 Scotland. They are classic historical fiction with a significant love story and a surprising amount of time travel. Because Outlander has been a popular series for nearly 30 years, there is a fair amount of analysis and fan work already online. In fact, someone has already created an elaborate map using Google Earth – I discovered this after I was deep into my own work and it was too late to brainstorm a new idea, so I plowed ahead with their data, already created, and imported it into Tableau. Although I successfully imported the geo data in and it appeared on a map, the learning curve was a bit steep for me to figure out how to assign different colors to different locations (for example – five chapters in one location as one color, etc). In other words: I didn’t know how to do what I wanted. I think the data would need to be amended at that point to have more columns than just the description of Chapter/Location and the geographic latitude/longitude data point. Too time consuming for this particular project at this time for me. So I sent myself back to the drawing board despite my hesitancy in starting over.
I also considered recreating the walking tour by German Traces, NYC/Goethe Institute, but I was eager to create something that does not already exist and would fit into the time frame I had to work and without already knowing how to use these platforms. I felt like a bit of a fish out of water for this assignment and still struggle with the data portion that can even get to the mapping portion. Do you use someone else’s data set (I know this is common and there are tons of open source ones) and manipulate it to fit your needs, or do you create something on your own, perhaps very simple, given the amount of work that goes into creating a data set, and have it be original?
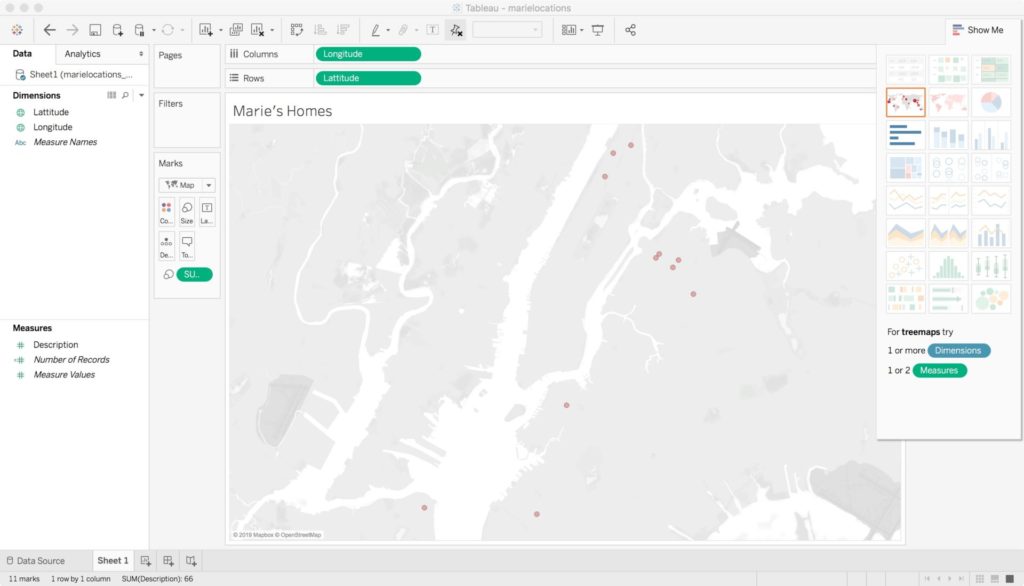
Because I decided to approach this as a learning opportunity, I opted for simple but original. I simply lacked the time necessary to create my own locations data set for a novel, or modify the Outlander one. However, since moving to NYC at the age of 18, I have lived in 12 different apartments in four of the five boroughs. I thought it would be fun to map this.
I used an online tool to get the Longitude/Latitude points for each apartment I have lived in, except for my current one, for some privacy. I used excel to create a sheet with a simple description of 1 through 11 and columns delineating longitude and latitude. I imported this as my data source into Tableau and voila. Although this seems really simple, it was a good learning process for me. I would love to go to a workshop and learn more about using Tableau and some of these other mapping softwares, as I’d love to be able to visualize more interesting data (as I’ve seen some of my classmates do for this assignment!) – but creating my own “data set” and experimenting with importing it, etc. was helpful for me. I am a hands on learner but it would have been more ideal to be walked through a first go, but this was also fun for me. I am eager to delve more into this, especially after our visualization class last week.
Now the big struggle: I used Tableau Desktop and so I do not have a link to share like I thought I would, so here is a screen shot. I was going to share my Tableau Workbook file, but WordPress wouldn’t allow that due to security reasons (so it said).