Author Archives: Robin Miller

The Triangle Shirtwaist Factory Fire Revisited: A Geospatial Exploration of Tragedy

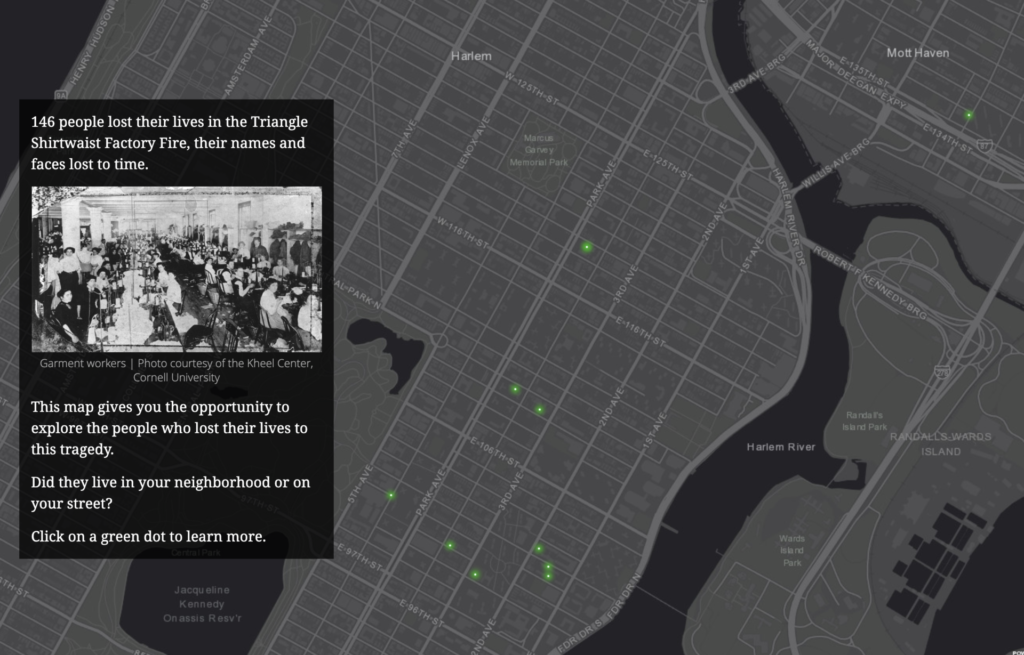
Can we use geospatial tools to explore the human condition and tragedy? The Triangle Shirtwaist Factory Fire Revisited: A Geospatial Exploration of Tragedy aims to do just that, by introducing the viewer to a historical event, the Triangle Shirtwaist Factory Fire of 1911, through the use of interactive geospatial technology. The project presents the viewer with the home addresses of all 146 victims of the Triangle Shirtwaist Factory Fire, their burial places, and major geographic points related to the fire, identified by points on a map. The project uncovers siloed documents and information, bringing them together in a singular context for a more intimate understanding of an event and the primary sources that document it. This project intends to create a single access point via a digital portal for interaction by the user. Creating this portal offers the user the freedom to interact with the information contained within the map at their own pace, and explore the information that most appeals to the user. The Triangle Shirtwaist Factory Fire Revisited project is built on a dataset complied from archive photographs, letters, journalism, artwork, home, work, and gravesite addresses all relating to the fire victims.

Resources related to the fire including images of people news coverage and legislation
Project Resources

Modeling historic events with geospatial data has been shown to be an impactful way to explore history in digital humanities projects such as Torn Apart / Separados http://xpmethod.plaintext.in/torn-apart/volume/1/, Slave Revolt in Jamaica, 1760-1761: A Cartographic Narrative http://revolt.axismaps.com/, and American Panorama: An Atlas of United States History http://dsl.richmond.edu/panorama/

The Triangle Shirtwaist Factory Fire Revisited continues the expansion of geospatial exploration in the digital humanities by presenting the user with the ability to explore the horrific event of the Triangle Shirtwaist Factory Fire through the lives of the victims. By creating an interface that will allow the user to explore an event through their own direction, the user can take ownership over learning about a historical event through their own research. This project encourages the user to examine underrepresented histories and also provides a way for them to engage with primary sources and digital tools. This project is committed to grounding geospatial concepts in the humanities for thinking critically about the relationships between events, people, movements, laws and regulations, and journalism.

prototype of map project dark mode
Prototype #1

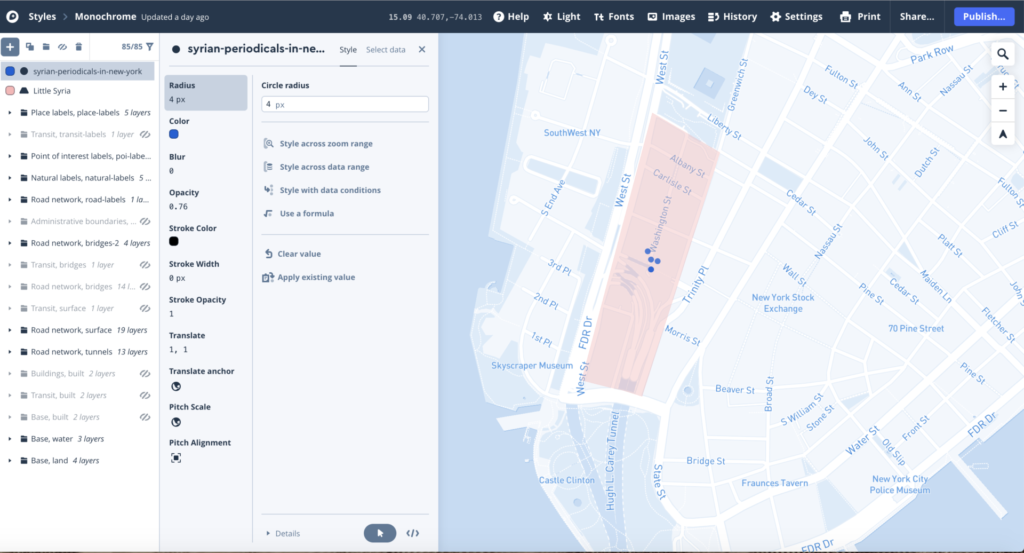
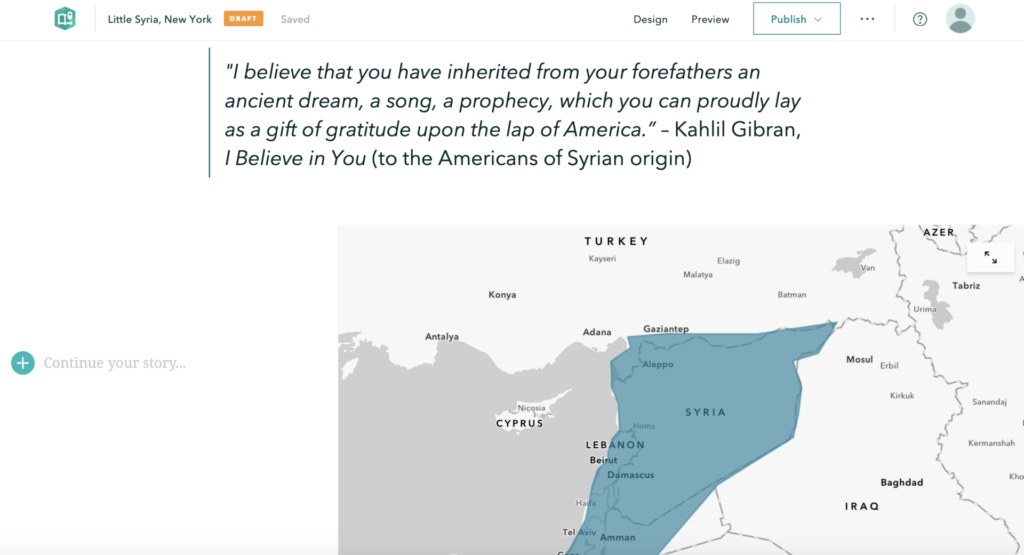
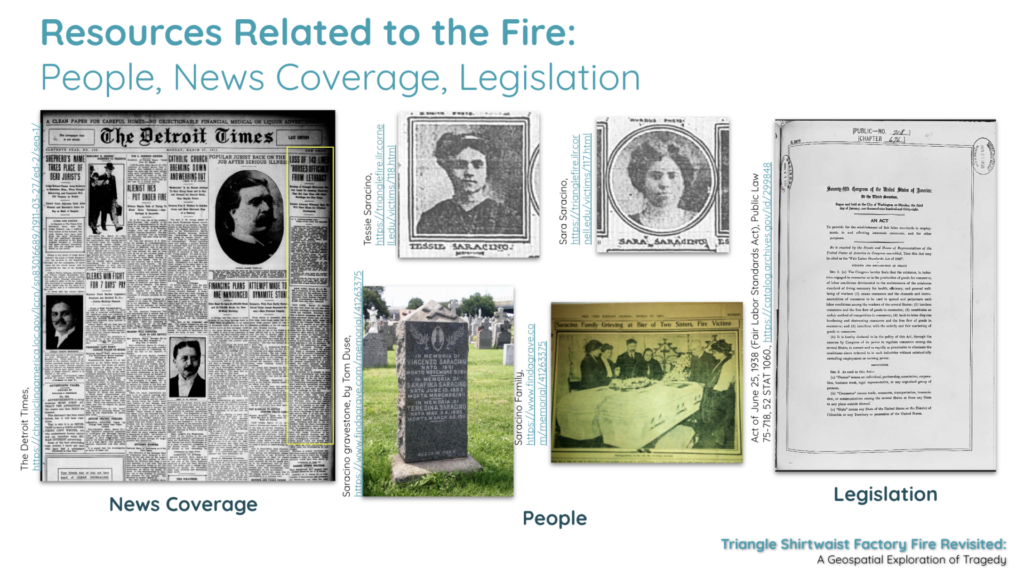
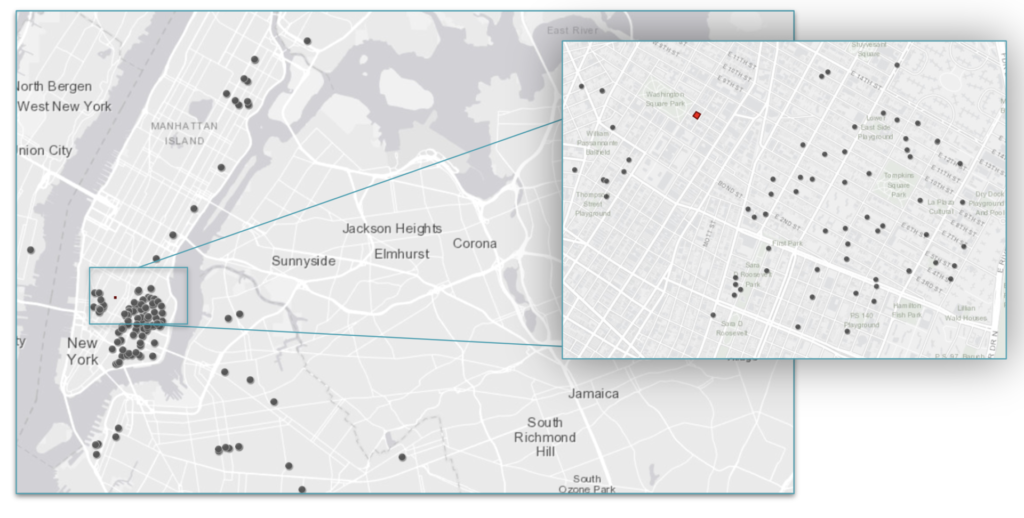
The Triangle Shirtwaist Factory Fire Revisited project will be built in three phases: 1) research and data collection, 2) prototype design and review 3) digital portal creation, followed by user testing. Phase 1) research and data collection— Information about the 146 victims was gathered from David Von Drehle’s book Triangle: The Fire that Changed America, the Cornell University Kheel Center website Remembering the Triangle Shirtwaist Factory Fire of 1911 (https://trianglefire.ilr.cornell.edu/) which includes Michael Hirsch’s research on the six previously unidentified victims and also from the Find A Grave website (https://www.findagrave.com/). Additionally, the information and letters included in Anthony Giacchino’s 2011 Triangle Fire Letter Project (http://open-archive.rememberthetrianglefire.org/triangle-fire-letter-project/) was included to add another dimension to the information landscape of these 146 victims. This information was compiled and reviewed for accuracy, then a dataset was built. Relevant primary and secondary sources were then identified and incorporated into the dataset. Addresses were geocoded (latitude and longitude locations added to the addresses). Phase one is complete. Phase 2) prototype design and review — The dataset built in phase one was then used to create several digital geospatial prototypes (see Appendix). Further review will need to be done to complete Phase 2 and move forward with the project. Phase 3) digital portal development, creation & user testing— For this phase, the project team will continue to review prototypes created in phase 2, determine the mapping software to be used, features and information to be included, and then begin building the final map. Once the digital map and interactive portal is complete, user testing will be begin and adjustments will be made based on comments and recommendations made by the user testing group, pending final approval by the project team.

prototype of map project grayscale
Prototype #2

The final product, a digital, interactive geospatial (map) interface documenting the Triangle Shirtwaist Factory Fire of 1911, that will allow the user to explore this historical event, and those connected to it, at their own direction will be published openly on the internet under a Creative Commons license that would allow others to freely use the code and dataset to build their own geospatial project. Once the project is publicly available, a Github repository for the tools used, data gathered, and dataset created will be established and populated, allowing further research to be done using the tools and data collected by the project team. In addition, a detailed account of the building of the project, including lessons learned, will be added to the Github repository with the hope of providing future researchers a formula for success and review of best practices for a digital mapping project. We will also use social media, blog posts on digital humanities and geospatial websites, conference talks and presentations with relevant academic associations to further publicize the project.

JSTOR Text Analyzer home page

JSTOR Text Analyzer

When I began this text analysis praxis, I thought I might try out one of the flashier tools in the list, maybe Voyant, Google N-Gram, or MALLET (which I did end up playing around a bit with, but ran out of time trying to find all the texts I wanted to build a decent sized corpus). I had hoped to end up with some interesting findings or at least some impressive images to share with you on this blog post! What I did decide on was the JSTOR Text Analyzer, definitely the least sexy option in the list, but for me, probably the most useful tool for my daily work as a librarian.

Excellent introduction video.

I will be completely honest and say that I am not a fan of paywalls and the companies that build them, that being said, many academic institutions subscribe to JSTOR and as an academic librarian I need to understand what are the tools that can best help library patrons. Using the Text Analyzer tool is simple, nothing to download, no code to write, you just upload a document with text on it, (they say even if it is just a picture of text) and the tool will analyze it and find key topics and terms, then you get to prioritize these terms, change the weight given to them in the search and use them to find related JSTOR content.

This all seems simple enough, they say they support a whole slew of file types (csv, doc, docx, gif, htm, html, jpg, jpeg, json, pdf, png, pptx, rtf, tif (tiff), txt, xlsx) and fifteen (!) languages including: English, Arabic, (simplified) Chinese, Dutch, French, German, Hebrew, Italian, Japanese, Korean, Polish, Portuguese, Russian, Spanish and Turkish. And as a bonus, they will even help you find English-language content if your uploaded content is in a non-English language. This all sounded too good to be true, so I thought I would go real-world and drop in a bunch of real syllabi (see course list below) from professors I have helped this semester and see how the JSTOR Text Analyzer would score.

Courses

  • Philosophy of Law (Department of Social Science)
  • Building Technology III (Department of Architectural Technology)
  • Information Design (Department of Communication Design)
  • Sustainable Tourism (Department of Hospitality Management)
  • Electricity for Live Entertainment (Department of Entertainment Technology)
  • Hospitality Marketing (Department of Hospitality Management)

The Process

The first course I tried was Philosophy of Law. I used the “Drag and Drop” feature to upload a pdf of the course syllabus. Once the file is “dropped” into the search box, the JSTOR Text Analyzer takes over and produces results in seconds. This is what my first search produced. The results were somewhat relevant to the course and not too bad for a first try. At this point I decided to add a few terms from the syllabus and change the weight that those terms are given in the search.

First search results based on syllabus upload only.

Here are the results of my second, modified search.

Results based on added and deleted terms and increased term weight.

Next I uploaded a csv file of a syllabus for Building Technology III. The Text Analyzer had no problem with the change in file format. The search results for this course were a bit strange though, with an article about the Navy’s roles and responsibilities in submarine design being the first in my results list. I am not sure where the JSTOR algorithm inferred the military and submarine from as there was nothing in the syllabus that made reference to these subjects. Oh the mysteries of the “black box algorithm”.

Building Technology III, first search results.

I then did the same addition and deletion of terms and adjusted term weights as I did for the previous course, Philosophy of Law. The new search results were much closer to the actual course content, though I did expect to see more about steel.

Building Technology III, second search results.

For my next experiment, I chose to take a screenshot of the syllabus for Information Design and import the png image file into the Text Analyzer. Unfortunately, even though they say they support png files, I received the following when I uploaded mine.

Uh oh!

File types supported
You can upload or point to many kinds of text documents, including: csv, doc, docx, gif, htm, html, jpg, jpeg, json, pdf, png, pptx, rtf, tif (tiff), txt, xlsx. If the file type you’re using isn’t in this list, just cut and paste any amount of text into the search form to analyze it.

https://www.jstor.org/analyze/about

I then went back to uploading pdfs and did not have any further problems with importing the syllabus for Information Design. The initial search results were not bad and actually got worse when I modified the terms to reflect what was in the syllabus.

Information Design #1.
Information Design #2.

The syllabus for Electricity for Live Entertainment uploaded with no problems and the results were interesting and made reference to electricity but not entertainment.

Electricity for Live Entertainment #1.

The modified results were far more relevant to the course content.

Electricity for Live Entertainment #2.

I then moved on the Sustainable Tourism. Things went really weird when I tried to upload a url for a course website that contained the syllabus (all these are Open Educational Resource – OER – courses) and the Text Analyzer picked up some crazy stuff, maybe from the metadata of the website itself??

Strange things are happening.

I then uploaded the syllabus directly, as a pdf and received pretty accurate search results.

Sustainable Tourism #1.

Modified results for Sustainable Tourism were even better.

Sustainable Tourism #2.

The search results for Hospitality Marketing, upload by pdf, were completely off, not even close.

Hospitality Marketing #1.

 Modified terms and weights gave me much better and more accurate results.

Hospitality Marketing #2.

My Thoughts

In the end, the JSTOR Text Analyzer is not a bad tool for finding content based on textual analysis of an imported file. Upload is simple and the results, while mixed, are generally in the ballpark. Adjustment of terms and weight is almost alway necessary, but not difficult to do. I probably use and recommend this tool. I did not log in and instead used the “open” version of content, but if you have access to JSTOR content through your institution, you would probably get different and maybe even better results.

And because no text analysis project is complete without a world cloud, here is one I made using text from all the syllabi I uploaded into the JSTOR Text Analyzer.

Syllabi word cloud.

Little Syria, New York

I used this praxis as an exploratory step in what I hope will become a larger project and potentially my thesis/capstone work. Recently I had the opportunity to walk the area of downtown Manhattan that was known during the late 19th and early 20th centuries, roughly 1880-1940, as Little Syria with GC historian and president of the Washington Street Advocacy Group, Todd Fine and music historian Ian Nagoski. I have not lived very long in New York City, so going in my knowledge of the history of this area and people who had lived there was rudimentary at best. That being said, I wanted to learn more about this group of immigrants from the Eastern Mediterranean and their role in the history of New York City, especially as the perception of immigrants from this part of the world remains so highly contentious. I have a background in Islamic/Middle East Studies and Arabic language and have been looking for a bridge to connect my current study of the digital humanities with my previous work in the Middle East. I think this project may just be that bridge.

“I believe that you have inherited from your forefathers an ancient dream, a song, a prophecy, which you can proudly lay as a gift of gratitude upon the lap of America.”

– Khalil Gibran, I Believe in You (to the Americans of Syrian origin)
Ottoman map of Greater Syria circa 1803

The walking experience of Little Syria was an incredible dive into the physical history of the area which was located on Washington Street, just south of the 9/11 memorial to Battery Park, but it was also an auditory exploration of recordings created by its residents, provided in the form of  a playlist by Ian Nagoski. The name Little Syria, can be a little misleading as it refers to the region of Greater Syria, which in the late 19th/early 20th century included parts of Iraq, Israel, Jordan, Lebanon, Palestine, and Syria, and was given to the area because it was the origin point of the majority of the population who lived there. Most of the buildings in Little Syria were demolished when the Brooklyn-Battery Tunnel was built in the 1940s, with just a few buildings remaining, including the St. George Chapel (white building on the right in the picture below, which was designated a New York City landmark in 2009 and is now home to the St. George Tavern).

St. George Tavern, Little Syria, New York

This walking experience got me thinking about the past and how I might explore the intersections of the history of Little Syria, the history of New York City, the experience of the immigrant’s “American Dream”, and our relationship with immigrants, all within a hauntological (“always-already absent present”) framework (simple, right?!) and could I use some sort of map to do it? I knew that I would not have time to build anything even close to what I envision for a final project, but as with any project, you have to start somewhere.

I have experience mapping using many of the applications that we read about in “Finding the Right Tools for Mapping” and I was not sure which would be the best for this project but first I needed some data. I must admit that I fell down many of the same “rabbit holes” that I have fallen down in the past, including spending far too much time looking for data resources, learning there were none and then having to find and build my own datasets which (I knew from past experience) requires a ridiculous amount of time, though I do seem to always underestimate just how long it takes.

I began by playing around a bit in Mapbox with a very small dataset that I built of the locations of Syrian Periodicals in New York based on information from The Syrian American Directory Almanac (1930). It turned out to be nothing particularly exciting so I decided to build something in Storymaps, which was not particularly exciting either.

In the end, I am still not sure what direction this project is going but it was an interesting exploration with mapping applications.