New to quantitative text analysis, I began this assignment with Voyant and Frederick Douglass’s three autobiographies. Not only are the texts in the public domain, but their publishing dates (1845, 1855, and 1881) punctuate the nation’s history that he helped shape across years that saw the passage of the Fugitive Slave Act of 1850, the Civil War, and Reconstruction.
Voyant’s instant and multi-pronged approach was exciting. A superficial glance confirmed what I expected: each text is substantially larger than the former, and terms describing enslavement are most frequent. I played around, loving particularly the MicroSearch (because it reminded me of a dynamic viz of Darwin’s revisions of Origin of the Species) and the animated DreamScape.

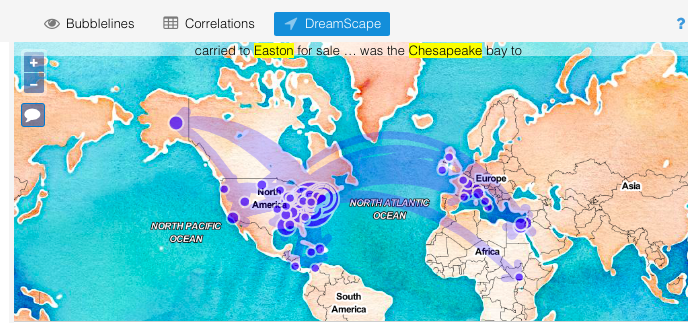
But, I saw clear errors that I couldn’t correct on this side of what Ramsay and Rockwell referred to as the “black box.” In DreamScape, “Fairbanks” had been misread as the name of the Alaskan city rather than a man who drives Douglass out of a school in St. Michael’s. The widget did allow me to view the text references it had mapped—a helpful peek under the hood—but without an option to remove the errant attribution. I remembered Gil’s suspicion in “Design for Diversity” of programs like Voyant. He warned that “use of these tools hides the vectors of control, governance and ownership over our cultural artifacts.” Particularly given the gravity of the subject of enslavement in the texts I was exploring, I thought I’d better create my own interpretive mistakes rather than have them rendered for me.
In last spring’s Software Lab, I’d had a week or two with Python, so I thought I’d try to use it to dig deeper. (The H in DH should really stand for hubris.) I read a little about how the language can be used for text analysis and then leaned heavily on a few online tutorials.
I started by tokenizing Douglass’s words. And though my program was hilariously clumsy (I used the entire text of each autobiography as single strings, making my program tens of thousands of lines long), I still was thrilled just to see each word and its position print to my terminal window.
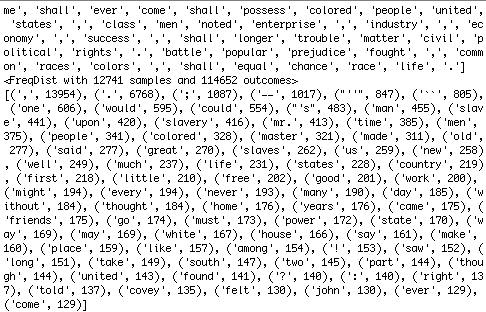
I then learned how to determine word frequencies. The top 20 didn’t reveal much except that I had forgotten to exclude punctuation and account for apostrophes—something that Voyant had done for me immediately, of course. But, because my code was editable, I could easily extend my range beyond the punctuation and first few frequent terms.
from nltk.probability import FreqDist
fdist = FreqDist(removing_stopwords)
print(fdist)
fdist1 = fdist.most_common(20)
print(fdist1)
So, I bumped 20 to 40, 40 to 60, and 60 to 80, when something interesting happened: the appearance of the name Covey. Despite my sadly eroding familiarity with Douglass’s life, I remembered Covey, the “slave breaker” whom enslavers hired when their dehumanizing measures failed to crush their workers’ spirits, and the man whom Douglass reports having famously wrestled and beat in his first physical victory against the system.
Excited by the find, I wanted to break some interesting ground, so I cobbled together a program that barely worked using gensim to compare texts for similarity. Going bold, I learned how to scrape Twitter feeds and compared Douglass’s 1855 text to 400 #BlackLivesMatter tweets, since his life’s work was dedicated to the truth of the hashtag. Not surprisingly given the wide gulf of time, media, and voice, there was little word-level similarity. So, I tried text from the November 1922 issue of The Crisis, the NAACP’s magazine. Despite the narrower gap in time and media, the texts’ similarity remained negligible. Too many factors complicated the comparison, from the magazine’s inclusion of ads and its poorly rendered text (ostensibly by OCR) to perhaps different intended audiences and genres.
Finally, I happened on “term frequency – inverse document frequency” (tf-idf)—a formula built to calculate the significance of words in a given text within a corpus by considering their frequency within that document and lack of it in the others. The Programming Historian offered a great tutorial using a range of obituaries from the New York Times as the corpus. Unfortunately for me, there were two errors in the code which took hair-pulling hours and a visit to the Python Users Group at CUNY to figure out. (I learned a brilliant and probably super obvious troubleshooting technique: when the line reference in the error doesn’t help, include print commands after chunks of code to see where the program is really breaking down.)
Eager to use my program on texts I chose, I returned to Douglass. Thanks to serendipity, I learned that Solomon Northup’s Twelve Years a Slave was published in 1853, just two years before Douglass’s second autobiography, My Bondage and My Freedom. My program, in thrilling seconds, spit out tf-idf findings of each document within the context of them together.
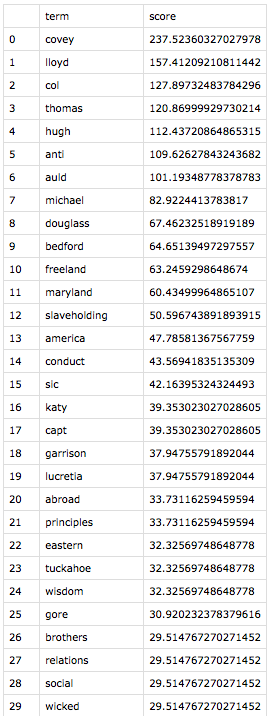
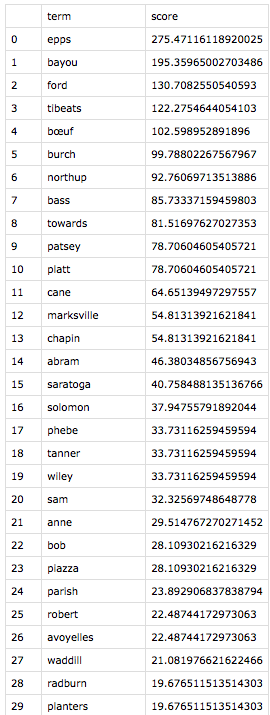
Both to make meaning out of the results and to make sure I wasn’t making errors like Voyant misreading Fairbanks, I investigated the instances of each of the top 21 words for each text. (Yes, I made the classic error of forgetting that index positions start with zero, so I focused on 0 – 20, not realizing that I was looking at 21 terms in each list.) In “All Models Are Wrong,” Richard Jean So had mentioned, “Perhaps the greatest benefit of using an iterative process is that it pivots between distant and close reading. One can only understand error in a model by analyzing closely the specific texts that induce error; close reading here is inseparable from recursively improving one’s model.” So, as distant reading led to close reading, exciting patterns across these two narratives emerged.
While the top 21 terms are unique to each text, these results share categories of terms. The highest-ranked term for each narrative is an ungodly cruel white man–Covey for Douglass, and Epps for Northup. Also statistically significant are enslavers whom the authors deem “kind,” geographical locations that symbolize freedom, stylistic terms unique to each author, and terms that are inflated by virtue of having more than one meaning in the text. I arrived at these categories merely by reading the context of each term instance—a real pleasure.
In digging in, I came to appreciate Douglass’s distinctive rhetorical choices. Where both authors use the term “slavery,” only Douglass invokes at high and unique frequency the terms “anti-slavery” and “slaveholding”—both in connection to his role, by 1855, as a powerful agent for abolition. The former term often refers quite literally to his career, and he uses the latter, both as an adjective and gerund, to distinguish states, people, and practices that commit to the act of enslavement. Like the term “enslaver,” Douglass charges the actor with the action of “slaveholding”—a powerful reminder to and potential indictment of his largely white audience.
I was most moved by the presence on both lists of places that symbolize hope. The contrasts of each author’s geographic symbols of freedom highlight the differences in their situations. Stolen from New York to be enslaved in far off Louisiana, Northup’s symbol of freedom is Marksville, a small town about 20 miles away from his plantation prison. A post office in Marksville transforms it in the narrative to a conduit to Saratoga, Northup’s free home, and thus the nearest hope. By contrast, Douglass, born into enslavement in Maryland, was not only geographically closer to free states, but he also frequently saw free blacks in the course of his enslavement. Making his top 21 includes nearby St. Michael’s, a port where he saw many free black sailors who, in addition to their free state worked on the open seas—a symbol of freedom in its own right. He also references New Bedford, Massachusetts, his first free home, like Northup’s Saratoga. America also makes his list, but Douglass invokes its promise rather than its reality in 1855—again perhaps more a choice for his white readers than for a man who, at this point, had never benefited from those ideals.
This distant-to-close reading helped bring to my consciousness the inversion of these men’s lives and the structure of their stories. For the bulk of their autobiographies, Northup moves from freedom to bondage, Douglas from bondage to freedom.
Given the connections between the categories of these unique terms, I was eager to “see” the statistics my program had produced. I headed to Tableau, which I learned in last summer’s data viz intensive.
After a lot of trial and error, I created what I learned is a diverging bar chart to compare the lists with some help from this tutorial. The juxtaposition was fascinating. Northup’s top terms mirrored those we’d see in the tale of any epic hero: helpers (both black and white) and myriad obstacles including the capitalized Cane, the crop that at this point ruled Louisiana. Further, his list includes his own names, both free (Solomon and Northup) and forced on him in enslavement (Platt), as if he needs to invoke the former as a talisman against the latter, textually reasserting his own humanity.
By contrast, Douglass’s top 21 is filled nearly exclusively with the men and women of the white world, whether foes or “friends.” His own names, enslaved or chosen, recede from his list (the appearance of Douglass on it is largely from the introductory material or references he makes to the title of his first autobiography).
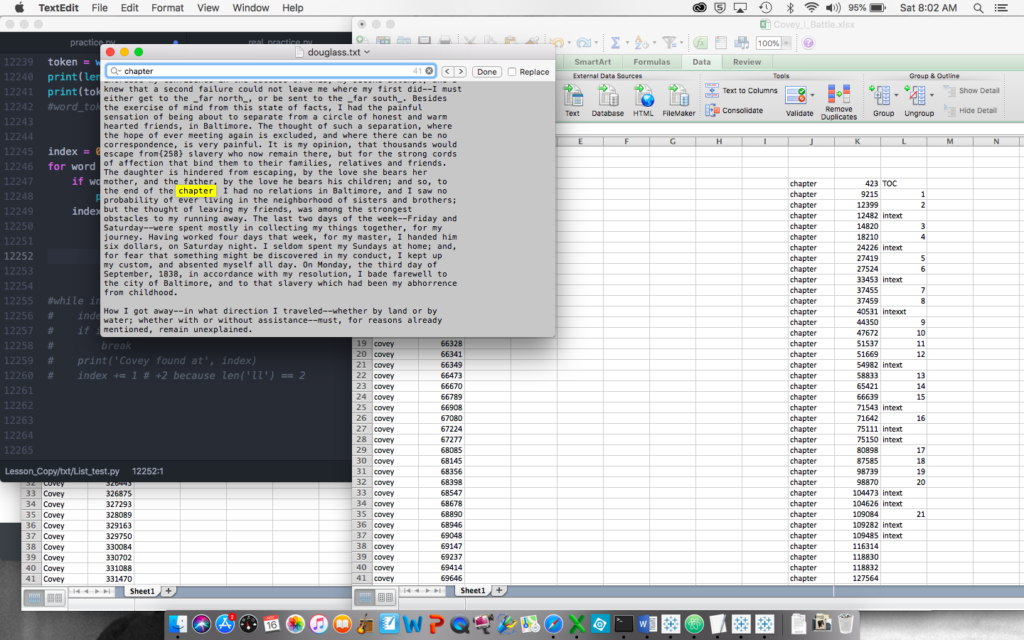
Given Douglass’s patterns, I wanted to visualize his articulation of his struggle to claim himself against the soul-owning white world he was forced to serve. So, I adapted my Python tokenizing program to search for the location of the occurrences of “Covey” and “I” for Douglass and “Epps” and “I” for Northup. (I left alone the objective and possessive first-person pronouns, though I’d love to use the part-of-speech functions of NLTK that I’ve now read about.) This was the first program I created that had multiple uses: I could search the location of any term throughout the text. In addition to those I wanted to map, I also pulled the location of the word “chapter” so I could distribute the term locations appropriately into more comprehensible buckets than solely numbers among thousands. This required some calculated fields to sort list locations between first and last words of chapters.
I never quite got what I was looking for visually.* But analytically, I got something interesting through a stacked bar chart.

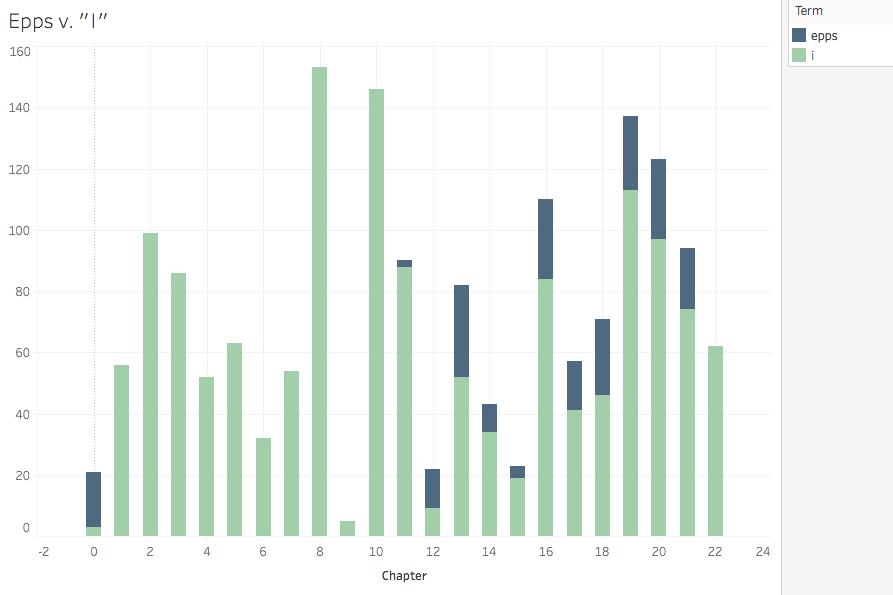
These charts suggest that Douglass’s battle with the cruelest agent of the cruelest system is fierce and fairly central—a back in forth of attempted suppression, with Douglass winning in the end. Nearly 500 self-affirming subject pronouns proclaim his victory in the penultimate chapter. Northup’s battle is far more prolonged (Epps is, after all, his direct enslaver rather than Covey who is more episodic for Douglass), and though he ends up victorious (both in the Epps/I frequency battle and in the struggle for emancipation), Epps lingers throughout the end of the narrative. I purposefully placed the antagonists on the top of the stack to symbolize Covey and Epps’ attempts to subjugate these authors.
As I’ve reviewed my work for this write-up, I’m hoping Richard Jean So will be pleased to hear this: my models are fraught with error. I should have been more purposeful in what counted as the text. Aside from the introductory material in chapters that I designated as 0, I did not think through the perhaps misleading repetition of terms natural in tables of contents and appendices. Also, by focusing on the top terms of the tf-idf calculations, I missed errors obvious had I looked at the bottom of the list. For example, while tokenizing, I should have accounted for the underscores rife in both texts, particularly in the tables of contents and chapter introductions, which might have changed the results.
The exercise also raised myriad questions and opportunities. I find myself wondering if Northup, upon regaining his freedom, had read Douglass’s first autobiography, and if Douglass had read Northup’s before writing his second. I think tf-idf is intended to be used across more than just two documents, so I wonder how these accounts compare to other narratives of enslavement or the somewhat related experiences of abduction or unjust imprisonment. Even within this two-text comparison, I’d like to expand the scope of my analysis past the top 21 terms.
Opportunities include actually learning Python. Successes still feel accidental. I’d like to start attending the Python User’s Group more regularly, which I might be able to pull off now that they meet Friday afternoons. My kindergarten skills for this project led to lots of undesirable inefficiency (as opposed to the great desirable inefficiency that leads to some marvelous happenstance). For example, I named my Python, Excel, Word, and Tableau files poorly and stored them haphazardly, which made it tough to find abandoned work once I learned enough to fix it. I’d also really love to understand file reading and writing and path management beyond the copy-from-the-tutorial level.
Regardless, I’m convinced that, for the thoughtful reader, distant reading can inform and inspire close reading. In fact, I’ve got a copy of the Douglass in my backpack right now, lured as I’ve become by the bird’s eye view.
*The area chart below of the terms Epps and I in the Northup is closer to what I wanted from a design perspective—the depiction of friction and struggle—but it’s not great for meaning, as the slope between points are fillers rather than representations of rises in frequency over time.


Kelly,
I had read your blog from my phone when you first posted it, but now reading it again, i realized how much work you put into it. I really like the Covey:I/ Epps:I I lexical analysis that you did. and the visualization of the enslavers on the top bar as a representation of their subjugation. We can definitely compare our codes next time we meet. I’d love to.