I remember being somewhat irked this semester by Ryan Cordell’s
criticism of DH. One line was particularly grating: “They speak of ‘DH’ as an
identifiable and singular thing, even if that thing contains multitudes, when
in fact DH is often local and peculiar: a specific configuration of those
multitudes that makes sense for a given institution, given its faculty, staff,
and students, and given its unique mission and areas of strength.” My
perturbation sprung from the irony that Cordell was enjoying publication in Debates in the Digital Humanities. His
thinking (even though it involved sniping at the very label under which he
published) already had a home and a receptive audience. Secondary school
digital humanists have no such luxury. Our pedagogical victories are painfully “local
and peculiar,” dispersing themselves in the air (or worse, in the graveyards of
our schools’ websites) with no choir’s “amen” or thoughtful challenges in response.
And yet, we secondary-school educators have been doing what we now call DH for
over two decades.
Early practitioners experimented in ways never intended by corporate programs to help students access, analyze, and create history, art, and literature. As I mentioned in our discussion about hacking, we turned Excel spreadsheets into clickable maps and art annotators, we asked students to use PowerPoint’s slide sorter view to group shards of Greek pottery into distinctive artistic periods, and we hijacked Word’s comment feature to have students layer collaborative literary analysis (literally by swapping machines) long before Google Docs existed. We even did our own low-tech version of distant reading, comparing word counts of novels or using the “find” tool to search for frequent terms.
As schools purchased hardware and software in bulk, companies such as Microsoft hosted grand national (and technically, international, with the inclusion of Australia and Canada) conferences for teachers of all disciplines to share their pedagogy, the majority of whom turned out to be humanities teachers looking to ignite hands-on interactivity and exploration in their lab-less classrooms.
That corporate interest dwindled as schools evolved their
programs around 2005, some shifting to bring-your-own-device structures and some
opting for free or open-source software. And as STEM became the educational acronym
of the millennium, maker conferences eclipsed those focused on the humanities,
and that has left us the nomads of the DH and educational worlds.
So, I’ve proposed DH Juvenilia: a digital humanities journal for secondary school educators. The name is intended to be self-effacing, capturing both our nascent collective ideology as well as the wonderfully rough and unselfconscious nature of young adult education. As I mentioned in my lightening talk, the site would be modeled on the Journal for Interactive Technology and Pedagogy (JITP),borrowing its peer-review model and its editorial sections that include lesson plans, reviews of resources and conferences, and a celebration of classroom failures. But, given our work this semester, DH Juvenilia would also offer two additional sections: one dedicated to issues of race and accessibility in the secondary-school classroom, and another to partnerships such as those between private and public schools or between schools and institutions such as local archives or museums.
My research for the environmental scan confirmed my own lived experience. Like DH in its infancy in higher-ed, secondary-school DH programs are scattered, defining themselves under a variety of names and living largely solitary lives. They’ve been included in a few panels at recent DH conferences (thanks, Matt, for the heads-up on Trevor Day School’s program), but those flashes in the pan, without fellow secondary school attendees, have done little to foster a broader dialogue and a more unified set of practices. DH Juvenilia would meet that need.
What did surprise me was how many resources are just waiting to be tapped to define a national or international secondary-school DH scene. As the grant proposal structure required a work plan, I realized that I and my digitally inclined humanities colleagues have partnered with a host of institutions either directly or indirectly leading the field: we’ve recently coached the MLA on the future of humanities in secondary schools, and we’ve partnered with institutions such as Juilliard, the Museum of Fine Arts, and the Kennedy Center. We’ve videoconferenced with classrooms around the globe, and we count among us native speakers of many languages. We are even (though not as much as I would like) a range of races, classes, disciplinary interests, and physical and attentional abilities. This recognition made the prospect of garnering writers, reviewers, supporters, and readers seem imminently doable. It also made my hopes of creating a diverse team (rather than reverse-engineering “accessibility”) somewhat possible.
In short, I finished my proposal feeling incredibly optimistic about the project. Sadly, I felt less optimistic in my abilities to write a grant. Trying perhaps too hard to fit the models, I found myself writing in circles, striving to cover too much ground too thinly. Arguments that could be paper-length in and of themselves got chopped into phrases to make way for the next claim, and I found myself writing much like I speak at parties: painfully self-consciously. Suddenly, the criticisms I leveled last week at authors who obscure their meaning behind multisyllabic academic jargon seemed to have been stones launched from the proverbial glass house. Clearly, while the semester is over, I still have homework to do: signing up for a grant-writing workshop.
New to quantitative text analysis, I began this assignment with
Voyant and Frederick Douglass’s three autobiographies. Not only are the texts
in the public domain, but their publishing dates (1845, 1855, and 1881)
punctuate the nation’s history that he helped shape across years that saw the
passage of the Fugitive Slave Act of 1850, the Civil War, and Reconstruction.
Voyant’s instant and multi-pronged approach was exciting. A
superficial glance confirmed what I expected: each text is substantially larger
than the former, and terms describing enslavement are most frequent. I played
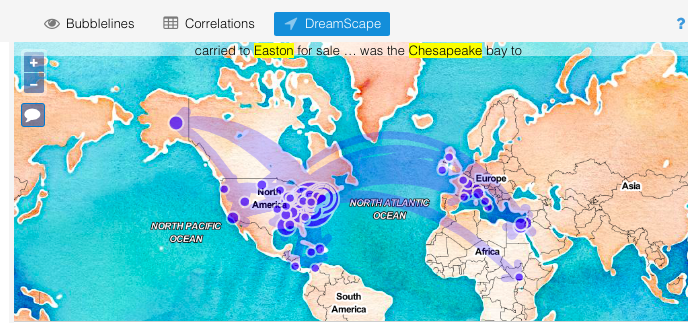
around, loving particularly the MicroSearch (because it reminded me of a dynamic viz of Darwin’s revisions of Origin of the Species) and the animated DreamScape.
MicroSearch of The Narrative of the Life of Frederick Douglass, American Slave (1845), My Bondage and My Freedom (1855), and The Life and Times of Frederick Douglass (1881). Voyant identifies the frequent term “slave” by default.Voyant DreamScape of places it thinks are referenced in the texts listed above.
But, I saw clear errors that I couldn’t correct on this side of what Ramsay and Rockwell referred to as the “black box.” In DreamScape, “Fairbanks” had been misread as the name of the Alaskan city rather than a man who drives Douglass out of a school in St. Michael’s. The widget did allow me to view the text references it had mapped—a helpful peek under the hood—but without an option to remove the errant attribution. I remembered Gil’s suspicion in “Design for Diversity” of programs like Voyant. He warned that “use of these tools hides the vectors of control, governance and ownership over our cultural artifacts.” Particularly given the gravity of the subject of enslavement in the texts I was exploring, I thought I’d better create my own interpretive mistakes rather than have them rendered for me.
In last spring’s Software Lab, I’d had a week or two with
Python, so I thought I’d try to use it to dig deeper. (The H in DH should
really stand for hubris.) I read a
little about how the language can be used for text analysis and then leaned
heavily on a few online tutorials.
I started by tokenizing Douglass’s words. And though my
program was hilariously clumsy (I used the entire text of each autobiography as
single strings, making my program tens of thousands of lines long), I still was
thrilled just to see each word and its position print to my terminal window.
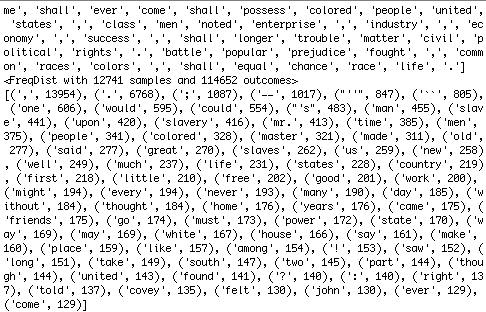
I then learned how to determine word frequencies. The top 20
didn’t reveal much except that I had forgotten to exclude punctuation and
account for apostrophes—something that Voyant had done for me immediately, of
course. But, because my code was editable, I could easily extend my range beyond
the punctuation and first few frequent terms.
from nltk.probability import FreqDist fdist = FreqDist(removing_stopwords) print(fdist)
fdist1 = fdist.most_common(20) print(fdist1)
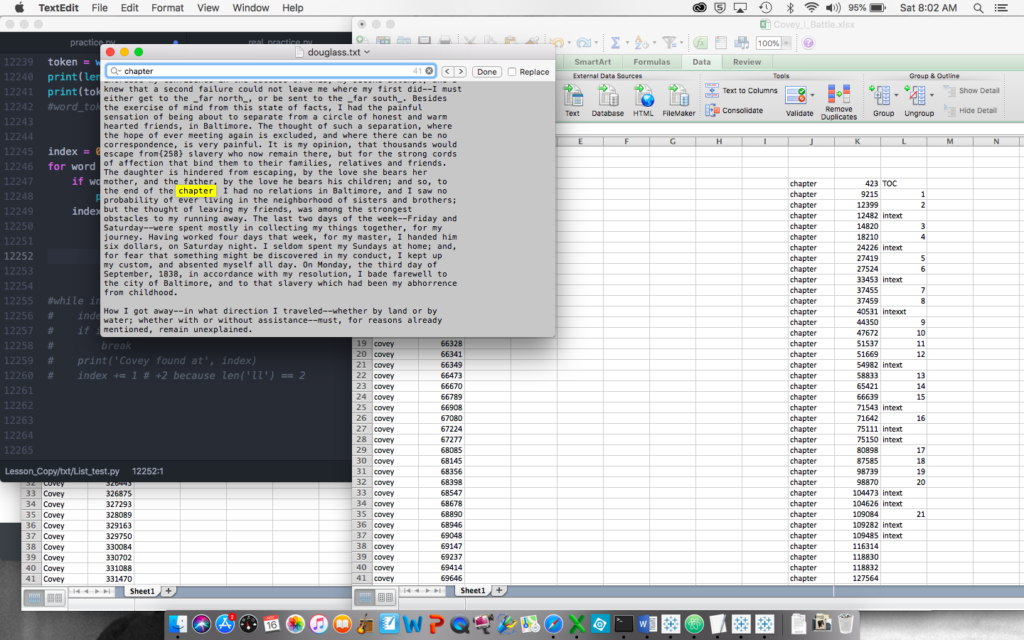
So, I bumped 20 to 40, 40 to 60, and 60 to 80, when
something interesting happened: the appearance of the name Covey. Despite my
sadly eroding familiarity with Douglass’s life, I remembered Covey, the “slave
breaker” whom enslavers hired when their dehumanizing measures failed to crush
their workers’ spirits, and the man whom Douglass reports having famously
wrestled and beat in his first physical victory against the system.
Covey shows up when the frequency list includes 80 terms. (Note all the punctuation that precedes it in frequency!)
Excited by the find, I wanted to break some interesting ground, so I cobbled together a program that barely worked using gensim to compare texts for similarity. Going bold, I learned how to scrape Twitter feeds and compared Douglass’s 1855 text to 400 #BlackLivesMatter tweets, since his life’s work was dedicated to the truth of the hashtag. Not surprisingly given the wide gulf of time, media, and voice, there was little word-level similarity. So, I tried text from the November 1922 issue of The Crisis, the NAACP’s magazine. Despite the narrower gap in time and media, the texts’ similarity remained negligible. Too many factors complicated the comparison, from the magazine’s inclusion of ads and its poorly rendered text (ostensibly by OCR) to perhaps different intended audiences and genres.
Finally, I happened on “term frequency – inverse document frequency” (tf-idf)—a formula built to calculate the significance of words in a given text within a corpus by considering their frequency within that document and lack of it in the others. The Programming Historian offered a great tutorial using a range of obituaries from the New York Times as the corpus. Unfortunately for me, there were two errors in the code which took hair-pulling hours and a visit to the Python Users Group at CUNY to figure out. (I learned a brilliant and probably super obvious troubleshooting technique: when the line reference in the error doesn’t help, include print commands after chunks of code to see where the program is really breaking down.)
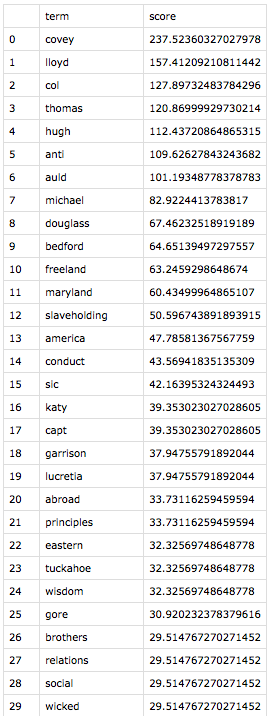
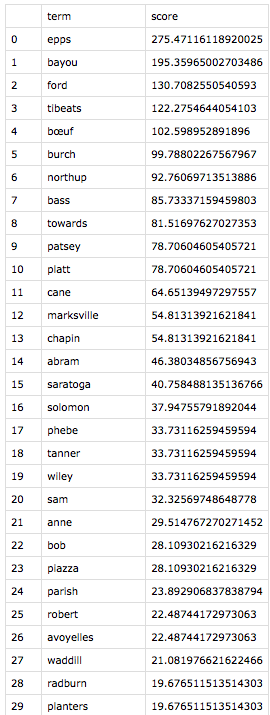
Eager to use my program on texts I chose, I returned to Douglass. Thanks to serendipity, I learned that Solomon Northup’s Twelve Years a Slave was published in 1853, just two years before Douglass’s second autobiography, My Bondage and My Freedom. My program, in thrilling seconds, spit out tf-idf findings of each document within the context of them together.
The tf-idf results of Douglass’s text compared with Northup’s.The tf-idf results of Northup’s text compared with Douglass’s.
Both to make meaning out of the results and to make sure I wasn’t making errors like Voyant misreading Fairbanks, I investigated the instances of each of the top 21 words for each text. (Yes, I made the classic error of forgetting that index positions start with zero, so I focused on 0 – 20, not realizing that I was looking at 21 terms in each list.) In “All Models Are Wrong,” Richard Jean So had mentioned, “Perhaps the greatest benefit of using an iterative process is that it pivots between distant and close reading. One can only understand error in a model by analyzing closely the specific texts that induce error; close reading here is inseparable from recursively improving one’s model.” So, as distant reading led to close reading, exciting patterns across these two narratives emerged.
While the top 21 terms are unique to each text, these results share categories of terms. The highest-ranked term for each narrative is an ungodly cruel white man–Covey for Douglass, and Epps for Northup. Also statistically significant are enslavers whom the authors deem “kind,” geographical locations that symbolize freedom, stylistic terms unique to each author, and terms that are inflated by virtue of having more than one meaning in the text. I arrived at these categories merely by reading the context of each term instance—a real pleasure.
In digging in, I came to appreciate Douglass’s distinctive rhetorical choices. Where both authors use the term “slavery,” only Douglass invokes at high and unique frequency the terms “anti-slavery” and “slaveholding”—both in connection to his role, by 1855, as a powerful agent for abolition. The former term often refers quite literally to his career, and he uses the latter, both as an adjective and gerund, to distinguish states, people, and practices that commit to the act of enslavement. Like the term “enslaver,” Douglass charges the actor with the action of “slaveholding”—a powerful reminder to and potential indictment of his largely white audience.
I was most moved by the presence on both lists of places that symbolize hope. The contrasts of each author’s geographic symbols of freedom highlight the differences in their situations. Stolen from New York to be enslaved in far off Louisiana, Northup’s symbol of freedom is Marksville, a small town about 20 miles away from his plantation prison. A post office in Marksville transforms it in the narrative to a conduit to Saratoga, Northup’s free home, and thus the nearest hope. By contrast, Douglass, born into enslavement in Maryland, was not only geographically closer to free states, but he also frequently saw free blacks in the course of his enslavement. Making his top 21 includes nearby St. Michael’s, a port where he saw many free black sailors who, in addition to their free state worked on the open seas—a symbol of freedom in its own right. He also references New Bedford, Massachusetts, his first free home, like Northup’s Saratoga. America also makes his list, but Douglass invokes its promise rather than its reality in 1855—again perhaps more a choice for his white readers than for a man who, at this point, had never benefited from those ideals.
This distant-to-close reading helped bring to my
consciousness the inversion of these men’s lives and the structure of their
stories. For the bulk of their autobiographies, Northup moves from freedom to
bondage, Douglas from bondage to freedom.
Given the connections between the categories of these unique
terms, I was eager to “see” the statistics my program had produced. I headed to
Tableau, which I learned in last summer’s data viz intensive.
After a lot of trial and error, I created what I learned is
a diverging bar chart to compare the lists with some help from this tutorial. The juxtaposition
was fascinating. Northup’s top terms mirrored those we’d see in the tale of any
epic hero: helpers (both black and white) and myriad obstacles including the capitalized
Cane, the crop that at this point ruled Louisiana. Further, his list includes
his own names, both free (Solomon and Northup) and forced on him in enslavement
(Platt), as if he needs to invoke the former as a talisman against the latter, textually
reasserting his own humanity.
By contrast, Douglass’s top 21 is filled nearly exclusively with
the men and women of the white world, whether foes or “friends.” His own names,
enslaved or chosen, recede from his list (the appearance of Douglass on it is
largely from the introductory material or references he makes to the title of
his first autobiography).
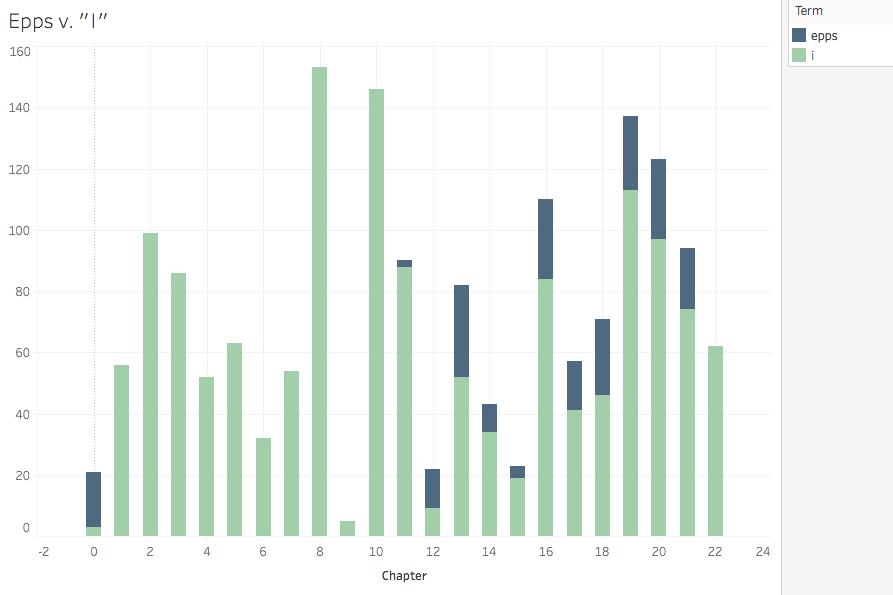
Given Douglass’s patterns, I wanted to visualize his articulation of his struggle to claim himself against the soul-owning white world he was forced to serve. So, I adapted my Python tokenizing program to search for the location of the occurrences of “Covey” and “I” for Douglass and “Epps” and “I” for Northup. (I left alone the objective and possessive first-person pronouns, though I’d love to use the part-of-speech functions of NLTK that I’ve now read about.) This was the first program I created that had multiple uses: I could search the location of any term throughout the text. In addition to those I wanted to map, I also pulled the location of the word “chapter” so I could distribute the term locations appropriately into more comprehensible buckets than solely numbers among thousands. This required some calculated fields to sort list locations between first and last words of chapters.
I never quite got what I was looking for visually.* But
analytically, I got something interesting through a stacked bar chart.
The occurrences of the terms “Covey” and “I” in the chapters of Frederick Douglass’s 1855 autobiography. Feel free to explore the interactive version.The occurrences of the terms “Epps” and “I” in the chapters of Northup’s 1853 autobiography. Feel free to explore the interactive version.
These charts suggest that Douglass’s battle with the cruelest agent of the cruelest system is fierce and fairly central—a back in forth of attempted suppression, with Douglass winning in the end. Nearly 500 self-affirming subject pronouns proclaim his victory in the penultimate chapter. Northup’s battle is far more prolonged (Epps is, after all, his direct enslaver rather than Covey who is more episodic for Douglass), and though he ends up victorious (both in the Epps/I frequency battle and in the struggle for emancipation), Epps lingers throughout the end of the narrative. I purposefully placed the antagonists on the top of the stack to symbolize Covey and Epps’ attempts to subjugate these authors.
As I’ve reviewed my work for this write-up, I’m hoping
Richard Jean So will be pleased to hear this: my models are fraught with error.
I should have been more purposeful in what counted as the text. Aside from the
introductory material in chapters that I designated as 0, I did not think
through the perhaps misleading repetition of terms natural in tables of
contents and appendices. Also, by focusing on the top terms of the tf-idf
calculations, I missed errors obvious had I looked at the bottom of the list.
For example, while tokenizing, I should have accounted for the underscores rife
in both texts, particularly in the tables of contents and chapter introductions,
which might have changed the results.
The exercise also raised myriad questions and opportunities.
I find myself wondering if Northup, upon regaining his freedom, had read
Douglass’s first autobiography, and if Douglass had read Northup’s before
writing his second. I think tf-idf is intended to be used across more than just
two documents, so I wonder how these accounts compare to other narratives of
enslavement or the somewhat related experiences of abduction or unjust
imprisonment. Even within this two-text comparison, I’d like to expand the
scope of my analysis past the top 21 terms.
Opportunities include actually learning Python. Successes
still feel accidental. I’d like to start attending the Python User’s Group more
regularly, which I might be able to pull off now that they meet Friday
afternoons. My kindergarten skills for this project led to lots of undesirable
inefficiency (as opposed to the great desirable inefficiency that leads to some
marvelous happenstance). For example, I named my Python, Excel, Word, and
Tableau files poorly and stored them haphazardly, which made it tough to find abandoned
work once I learned enough to fix it. I’d also really love to understand file
reading and writing and path management beyond the copy-from-the-tutorial
level.
Distant reading leads to close, as I check the instances of the word “chapter” in the Douglass to make sure that it is actually a chapter heading. In this case, it is not, so I deem it “in text” in my poorly organized Excel sheet which I later fix for use in Tableau.
Regardless, I’m convinced that, for the thoughtful reader, distant reading can inform and inspire close reading. In fact, I’ve got a copy of the Douglass in my backpack right now, lured as I’ve become by the bird’s eye view.
*The area chart below of the terms Epps and I in the Northup is closer to what I wanted from a design perspective—the depiction of friction and struggle—but it’s not great for meaning, as the slope between points are fillers rather than representations of rises in frequency over time.
Like Zach, I attended last week’s workshop on game-based
pedagogy. I must have misunderstood the description, for the majority of the
presentation focused on decades-old theories including Bloom’s Taxonomy from
the 1950s (revised in 2001) and Howard Gardner’s multiple intelligence theory from
the 1980s. I had expected far more modern thinking and at least some nod to digital
games. I left disappointed.
Mid-way through, I shifted gears as a participant, deciding to glean what I could by listening for what I hadn’t heard before. I appreciated Khadeidra Martin’s reminder that there’s a difference between “gamifying” the classroom and using games to help students learn. In the former, teachers simply include game elements, such as competition and point accumulation, in more traditional activities. So, for example, a teacher might “gamify” a class discussion by splitting the students into teams and awarding points for participation or source references. In the latter, teachers use games as the activity or the actual vehicle for learning, which is much more up my pedagogical alley.
I also appreciated her reminder of James Paul Gee’s earlyish work in the field. While the kids I currently teach were born after his famed Good Video Games and Good Learning came out in 2007, his articulation of the many reasons games can be compelling learning tools gave me a quick rubric from which to judge my current use of digital and homemade games in the classroom. For example, I use the brilliant suite of games at iCivics—especially Do I Have a Right?—to have the students learn about the Constitution before we tackle it. The experience is not only great fun for my kids, but it gives every student what Gee calls “performance before competence”—tapping her natural desire to jump right in before really knowing what she is doing. That fun gives the kids exactly the background they need to avoid being daunted by the challenging language of the document itself.
Of course, I might be spoiled. Jeff Allred’s Doing Things with Novels class offered
last fall introduced me to Twine and Ivanhoe*—two really
exciting, completely open-ended game platforms. Jeff had us experience Ivanhoe
as players, and I’ve never been so excited about archival research. I spent
countless hours (those fantastically absorbed hours when you forget to eat)
digging at the Schomburg Center and in digital troves so I could make good
moves.
In fact, I realize now that I was spoiled even before last
fall. Until 2009, I worked with a dynamite pedagogical gamer, Jeremiah McCall, who really broke
ground both in creating historical simulations and in using video games such as
Rome Total War as ways to turn
students on to the living reality that primary sources represent.
So, while I wouldn’t recommend this workshop unless you are new to teaching, I would recommend Steve Zweibel’s “Research for Master’s Students” which I took earlier this fall. In addition to sharing some helpful library resources, he reminded me of some research basics and tossed in some real gems such as an iterative process for refining research questions. I think he offers the talk each term.
Here are a few things I needed to hear Zweibel say:
When it comes to finding a research topic, don’t be afraid to start with what you’ve done before. The point of grad-level research is to push beyond familiarity into original discovery, so you’ve got a head start researching what you think you know.
Pursue debates and uncertainties. That’s fertile soil.
Research is iterative. Get your topic, find a question, learn some, refine your topic, find new questions, learn some more. Repeat, repeat, repeat.
Make sure your research is meaningful. A helpful exercise he offered is to fill in the following blanks: “I am studying ___________, because I want to find out what/why/how _______________ in order to help my reader understand ____________, which matters because __________________.
Take notes proactively. Include a summary of each source and thoughts on how you might use the information you took notes on so that you don’t have reread the whole source to remember how it might be valuable.
Finally, remember that citations are a big part of scholarly work. In addition to proving that your argument is evidence-based, citations position your ideas in a scholarly and collegial conversation.
*Yes, yes. That’s Drucker’s name on that linked Ivanhoe article!
My Process
While exploring Yarimar Bonilla and Max Hantel’s “Visualizing Sovereignty,” I was struck by the power of untethering the Caribbean islands from the too-familiar lands and waters that otherwise dwarfed or laid cultural claim to them by virtue of a colonial past. I was also struck by the “Invasion of America” video referenced therein, depicting the loss of native North American lands as Europeans arrived, colonized, and expanded. I’d seen the “Invasion of America” before, but I didn’t realize until now how much that visualization reinforces the Manifest Destiny mindset, almost confirming Andrew Jackson’s belief that Indigenous people “must necessarily yield to the force of circumstances and ere long disappear.”[1] That video, as helpful as it is in depicting colonial greed also focuses the story on indigenous loss rather than indigenous resilience.
So, for this project, I wanted to mimic Bonilla and Hantal’s process to map the sovereignty of Native American nations in hopes of challenging the popular defeatist tale.
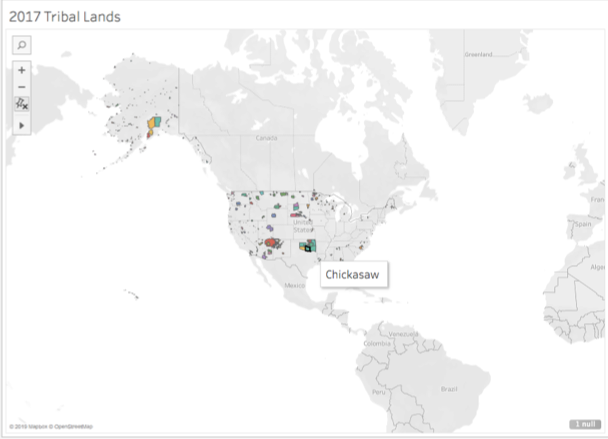
I started in Tableau, familiar to me after this summer’s Intro to Data Visualization intensive. I discovered a shapefile from the US Census Bureau demarcating the 2017 “Current American Indian/Alaska Native/Native Hawaiian Areas.” I had never worked with shapefiles, but found this one fairly intuitive to map in the program. I distinguished each officially recognized “area” (as the Bureau calls it) by color and added the indigenous nation’s name to the tooltip to make each area visually distinct. As does nearly every step of a mapping exercise, this alone yielded some insights. Oklahoma is nearly all designated land. The Navajo nation has a land allotment larger than some US states. Two of the largest land parcels in Alaska belong to tribes I hadn’t heard of: the Knik and the Chickaloon.
This first view also presented two significant problems, predicted by our readings both from Monmonier as well as Guiliano and Heitman. First, Tableau’s map projection is grossly distorted, with Greenland larger than the contiguous states, instead of 1/5 the size of them. Second, the limits of the data set—collected by and in service of the US government—cut out the indigenous people of Canada and Mexico, whose connections with the represented people are severed. What a visual reminder of a political and historical truth!
Screenshot of the Census Bureau’s mapped shapefile, with tooltip visible.
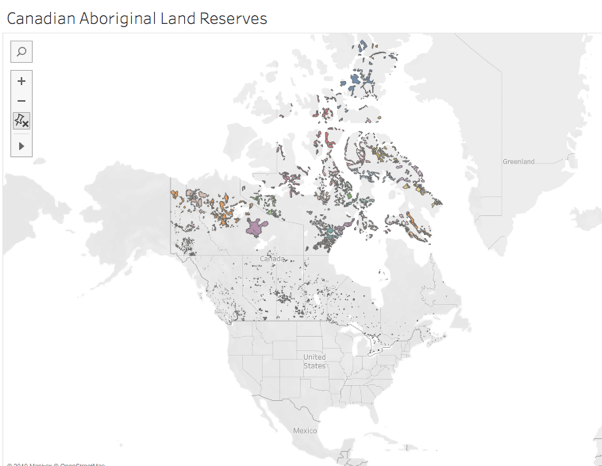
I did find a shapefile of Canadian aboriginal lands also from 2017, but couldn’t find a way to merge the geometries in one map. Mapping those Canadian reserves separately, I noted immediately how easy it is for political entities to be generous with lands they don’t value. (Of course, the map’s polar distortion may be enlarging that seeming, albeit self-serving, largesse.)
Screenshot of the Canadian government’s shapefile mapped.
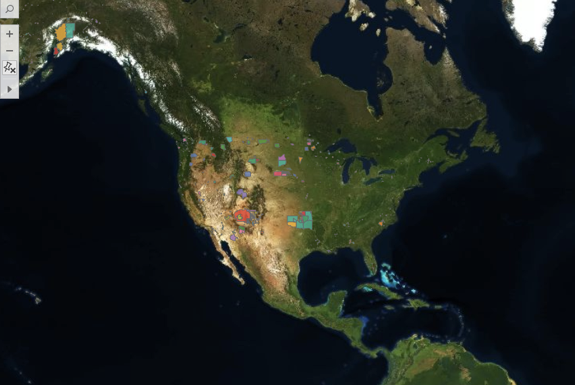
I returned to the US visualization to see if similar land prioritization was made, changing the base map to a satellite rendering.
Screenshot of the Census Bureau’s shapefile on a satellite map.
Again, the new view offered some insights. The effect of the Indian Removal Act of 1830 is clear, as the wooded lands east of the Mississippi seem (from this height) nearly native-free. Reservations are carved in less desirable spots and are pushed toward the interior as, in addition to the westward push from the east, states began to be carved from the West Coast after the Gold Rush.
Next, eager to mirror Visualizing Sovereignty in turning the power tables, I removed the base map altogether. De Gaulle’s “specks of dust” quote sprang to mind, as I saw, in full view, this:
Screenshot of the Census Bureau’s shapefile mapped, with the base map washed out.
Just this one act changed the scene for me entirely. Suddenly, Hawaii came into the picture, calling to mind its colonization in the name of strategic desirability. The whole scene reminded me of what Bonilla and Hantal (borrowing from Rodriquez) called “a nonsovereign archipelago, where patterns of constrained and challenged sovereignty can be said to repeat themselves.” I longed for the inclusion of the Canadian lands to flesh out the archipelago, though the missing data points to one such constraint and challenge.
Revealing just a surface level of the shifting sands of sovereignty, this data set includes ten distinct “classes” of recognized lands, so I included those in the ToolTips and offered an interactive component to allow users to isolate each class, foregrounding spaces that were connected by the US government’s classification of them. For example, choosing the D9 class (which the Census defines denoting a “statistical American Indian area defined for a state-recognized tribe that does not have a reservation or off-reservation trust land, specifically a state-designated tribal statistical area”) reduces the archipelago to a small southeastern corner—strongholds resistant, perhaps, to Jackson’s plans or perhaps more probably ones who went underground until the mid 20th century when the Civil Rights Movement empowered indigenous communities and gave birth to Native American studies.
The D9 class of recognized indigenous “areas.”
This divide-and-conquer, 10-class variety of sovereignty was underscored by the significant contrast in tone in the definitions of tribal sovereignty between the National Congress of American Indians (NCAI) and the US Bureau of Indian Affairs (BIA). The NCAI contextualizes and defines sovereignty with active, empowering language: “Currently, 573 sovereign tribal nations…have a formal nation-to-nation relationship with the US government. … Sovereignty is a legal word for an ordinary concept—the authority to self-govern. Hundreds of treaties, along with the Supreme Court, the President, and Congress, have repeatedly affirmed that tribal nations retain their inherent powers of self-government.”
In sharp contrast, the BIA contextualizes and defines sovereignty with passive, anemic language, explaining that, historically, indigenous tribes’ “strength in numbers, the control they exerted over the natural resources within and between their territories, and the European practice of establishing relations with countries other than themselves and the recognition of tribal property rights led to tribes being seen by exploring foreign powers as sovereign nations, who treatied with them accordingly. However, as the foreign powers’ presence expanded and with the establishment and growth of the United States, tribal populations dropped dramatically and tribal sovereignty gradually eroded. While tribal sovereignty is limited today by the United States under treaties, acts of Congress, Executive Orders, federal administrative agreements and court decisions, what remains is nevertheless protected and maintained by the federally recognized tribes against further encroachment by other sovereigns, such as the states. Tribal sovereignty ensures that any decisions about the tribes with regard to their property and citizens are made with their participation and consent.” “Participation and consent” are a far cry from “the authority to self-govern,” and even though the NCAI boasts of the Constitutional language assuring that tribes are politically on par with states, they make no mention of lack of representation in Congress or other such evident inequalities.
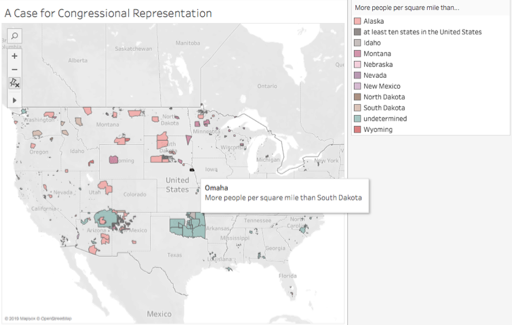
Shocked by the juxtaposition of these interpretations of sovereignty (and in a slightly less academically rigorous side jaunt), I pulled population data from Wikipedia into an Excel spreadsheet which I joined to my Tableau data. Using the World Atlas to compare population density of these reservations to the least densely populated states, I created an interactive view to show which reservations are more densely populated than the least densely populated states. Not surprisingly, many beat Alaska. But, other surprises emerged, such as the Omaha reservation’s greater population density than South Dakota, their neighbor to the north.
Screenshot of comparative population density.
I next wanted to recreate, in some way, the equalizing effect of the Visualizing Sovereignty project’s decision to same-size all of the Caribbean islands. But, with 573 federally recognized tribes, that seemed too ambitious for this assignment. So, I turned to video to record an exploration in zooming, giving some spots greater consideration than others, and starting in an oft-neglected place.
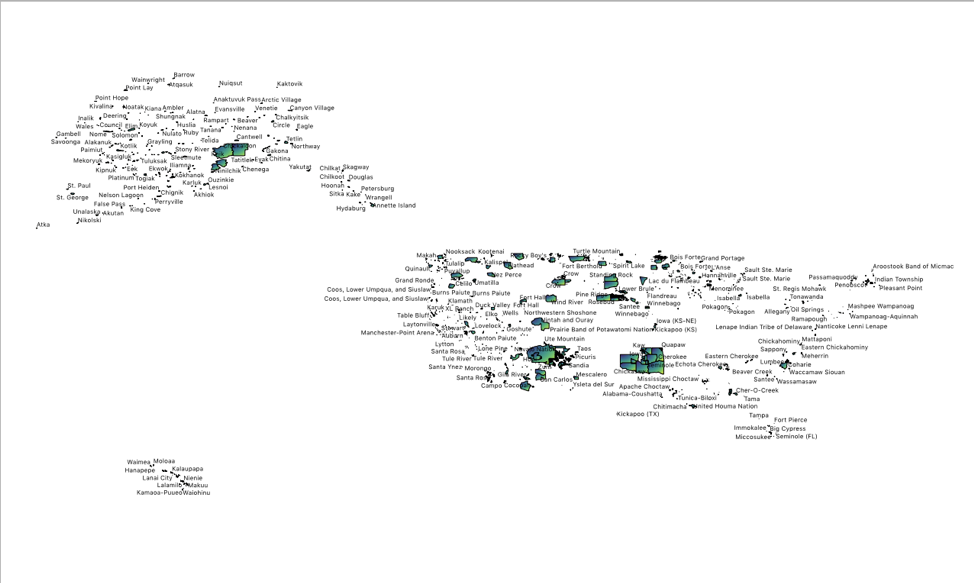
With Hawaii now foregrounded, the distortion of Tableau closer to the North Pole seemed too significant to neglect, so I learned a little QGIS in order to utilize its more size-righted mapping. Playing around with the new program, I found a powerful tool for foregrounding identity: labels. Merely including them turned the nonsovereign archipelago into a menacing swarm of equalized names. At all the same font size, they seemed like the Immortals of Xerxes’ Persian army, ever replenishing (as demonstrated in the linked, very rough video), regardless of how far away or close up I zoomed. They took over my RAM, slowing the display down with each change in scale, asserting themselves in greater detail the closer to the land I got and at their own pace. This view seemed to better represent the truth that contradicts Jackson’s prediction: the Indigenous have resisted and persisted despite all attempts to eradicate them. Further, this view points to the potential of collective action—a potential that may be best developed through DH, which can cut across geographic space.
A screenshot of the labels in QGIS
This project has raised for me a host of questions. What about the nearly 300 unrecognized tribes not included by the Census Bureau? What might be revealed if data from Canada and Central America were included, restoring indigenous domains to their geographic boundaries rather than their political ones? What happens if we introduce the element of time, as Visualizing Sovereignty did, to this visualization? (And, thinking of the Sioux Winter Coat, what if that temporal consideration were made through an indigenous representation of time keeping?) What happens if we look at this data as capta, including in it profiles of those reduced to geographic entities and statistics or map views that begin from each region (for example, the Hopi are surrounded by Navajo—a very different experience from the Quinault)? And how might digital humanities provide a platform or opportunities for sharing culture and resources across these spaces and histories?
[1]For the fully appalling context, read the paragraph twelfth from the bottom of his address to Congress on December 3, 1833. https://millercenter.org/the-presidency/presidential-speeches/december-3-1833-fifth-annual-message-congress
Three years ago, my department decided to address a problem:
teaching grammar. Our anecdotal evidence told us that our traditional method of
teaching “proper” English simply wasn’t working. First, we were turning a lot
of students off to the joy of language. Second, contrary to our hopes, the students
who earned the highest grades—those who technically mastered the lessons—were
sounding dry and alike rather than finding their own voices. Worst of all, we
were building a class of kids who felt superior for knowing that data is plural
or that whom is an object, and those kids often enjoyed mocking those who
didn’t get it.
Our department decided to embrace a new model—one of inquiry where we isolated grammatical concepts across the work of a host of powerful writers and asked students to consider and experiment with some of the many ways those writers employed or subverted the technique. The result was powerful and immediate: students started writing more effectively and more originally, not because they were writing “correctly” (which, ironically, they more often were), but because they were exploring how to communicate their ideas in ways that played into and played with their readers’ expectations. In short, we were asking them explore the expansive nature of language rather than to whittle it down to a single, “right” expression.
A decade ago, novelist Chimamanda Ngozi Adichie warned of
the danger of a single story in a TED talk that now boasts
over five million views. It’s hard to imagine any digital humanists who would
disagree with her, even those who dedicated that decade to works in the
Eurocentric canon. And yet, Roopika Risam’s piece, “What Passes for Human?
Undermining the Universal Subject in DH Humanities Praxis” reminds us how quick
we often are to accept a singular perspective when it comes to methodology. We may
be expansive when it comes to narratives or content, actively seeking to
broaden our scope. But, we often remain expediently reductive when it comes to
process. (Harrell takes that one step further: we are reductive even in the
logic that drives our computing.) In our search to create lifelike machines of
the future or algorithms that decide what images are memorable, the field
assumes a universal human—one that springs too quickly from the white legacy of
the ivory tower from which many DH centers spring themselves—and we often build
from there without reflection.
Risam’s examples of the results of such single-view methodology are harrowing. She relays the disastrous effects of assuming a universal ideal of language, of beauty, of humanity. Tay, Microsoft’s AI chatbot, became a racist, Holocaust denier in just hours of “learning” from American social media. Hanson Robotics, in an attempt to make its humanoid Sophia “beautiful” (and therefore approachable), created a thin, white female akin to a sentient Barbie. I found a New York Times article about a similarly flawed project, Google Photos that, because of the preponderance of white faces fed into the original data set, mistagged pictures of at least two black Americans as gorillas. That article conveys Google’s response to this singular thinking saying, “The idea is that you never know what problems might arise until you get the technologies in the hands of real-world users.”
But Risam says otherwise. She notes that we can anticipate
such problems if we re-examine the lens through which we come to our processes
and methodologies. In her words, “Given the humanity ascribed to such
technologies, it is incumbent on digital humanities practitioners to engage
with the question of what kinds of subjectivities are centered in the
technologies that facilitate their scholarship.” (O’Donnell et al. note that
those questions are relevant to the processes we use to seek out collaborators
or to choose locations for conferences, and Harrell notes that those questions
are relevant to the very electronic processes of our CPUs.)
Perhaps worse still is that even with evidence that a given praxis is fraught with gross cultural bias, many companies choose to eliminate the symptom rather than grapple with the problem. Instead of coding Tay to engage meaningfully with challenging subjects, she was was re-versioned as a vapid chatbot who avoids any suggestion of political talk, even when the prompt is mundane, such as, “I wore a hijab today.” Instead of feeding more and better pictures of humans of color into their photo-recognition data set, Google deleted the tags of “gorilla,” “monkey,” and “primate” altogether. (The term “white washing” seems appropriate on a variety of levels here.)
Perhaps, to me, the most seemingly benign example of this proliferation—and, in many ways therefore, the most insidious—of a singular view of what it is to be human is that of Jill Watson, IBM’s Watson project that now serves as a digital TA to college students. There is the very fact of her: a narrowly defined version of a human (like Sophia and Tay) who is, beyond being born out of a Eurocentric mindset, also now a gatekeeper to Western knowledge. But more frightening still, she is scalable. That same, singular voice could respond to hundreds and thousands of college students. She is, in effect, legion. She and projects like her (from Siri and Alexa to even Google, I suppose) repopulate the globe with a monolithic way of thinking, despite more expansive shifts in national and world demographics, replicating exponentially a sliver of all that humanity has to offer.
The readings and sites to explore this week, perhaps precisely because they were juxtaposed, presented interesting parallels between Digital Humanities and the Black Atlantic. Both seem to find themselves in constant pursuit of definition. Both, in that effort, struggle with the benefits and drawbacks of inclusion and exclusion. Both, too, contain in their very DNAs a vital pluralism of disciplines and denizens.
As I poked around in the last site assigned, the Early Caribbean Digital Archive out of Northwestern, I found myself drawn to the exhibit on Obeah, a religious power forged from the mix of spiritual traditions over time and across space in the Caribbean and an idea brand new to me. The more I read about Obeah, the more it sounded like DH as presented in the three intros to Debates in the Digital Humanities: a potentially powerful and mutable force for resistance and social change.
One section of the exhibit is entitled “Is Obeah religion,
science, or cultural practice?” Its opening lines sound similar to the 2012 Debates intro, as the ECDA explained: “The
answer to this is complicated, and it might depend on who you ask. For some, it
is distinctively one of these things, for others, it might be a combination of
them all.”
In other sections, the ECDA exhibit refers to the two most prominent responses to Obeah by the colonial powers: ridicule and fear. I’ve heard both from academic colleagues in response to DH.
The initial inception of the ECDA predates Debates, yet in the following lines I
hear echoes of Matt and Lauren’s 2016 call to consider what it means to expand
the field:
“While Obeah is not uniform or universal in its practice, it is inclusive. Because of the endless iterations of cultures, ethnicities, and colonizers coming together, all with different roots and belief systems, it would be nearly impossible to have uniformity in any way within the Obeah community. Instead, it sought out acceptance of all practices of Obeah.”
It’s not much of a stretch to read these lines with equal
truth when Obeah is replaced by DH and “cultures, ethnicities, and colonizers”
are replaced by “disciplines, methods, and practitioners.” Like Obeah, DH seems
stronger for its reach than its roots.
The ECDA goes on to say:
“This exhibit also foregrounds politics of gender and age in relation to obeah. Because of the nature and inclusivity of its practice, obeah was a mode of empowerment and social mobility for blacks, both free and enslaved, of a variety of different genders, marital statuses, and age groups. The history of obeah is often primarily oral and, as this exhibit shows, is also one that shifts to fit the circumstances of its people across time, location, and colonial situation.”
While perhaps less directly applicable, these lines too seem
to mirror the growth of DH—one that seeks dialogue with and input from a range
of areas of interests and expertise, of identities and stages of career, and of
speeds and scopes. DH, like Obeah, is flexible in form which allows it a kind
of shape-shifting ability in its work for social good in response to social
ills.
While these parallels may be reductive, one thing is for
certain: the ECDA is a clear example of good that DH can do because of its ability
both to utilize and to distance itself from traditional disciplines. It has
digitized sources from far-flung archives. It provides these sources for free
and without registration hurdles to the internet-enabled public (without much
demand on bandwidth, as far as my exploration can tell). It offers several
lenses through which to explore the collection, encouraging a broad range of
interpretation. And, it explicitly seeks to “decolonize the archive.”
Of course, the EDCA also makes some of the ethical missteps
the Debates intros unflinchingly
recognize: the ECDA is in English only, it was birthed in a well-funded and
American university, and many of its early project alums seem not to be of Caribbean
origin or descent. So, while the ECDA is already of real use, so much of its continued
success may rest on its ability to address these issues. As the 2019 Debates intro entreats us, “As
individuals and as a field, we must interrogate our work to ensure that we are
not ourselves complicit in the neoliberal practice of naming problems in order
to evade their resolution.”
Need help with the Commons?
Email us at [email protected] so we can respond to your questions and requests. Please email from your CUNY email address if possible. Or visit our help site for more information: