
My idea for this data visualization gave rise from an initiative that me and some other parents had in order to establish a dual language program for Greek –American elementary students in NYC public schools. Being a parent of elementary kids and having some of new media technology background I managed to make viral our effort through social media, blogs, website (http:greekdualny.org), digital question forms for parents and kids,petitions,and a word of mouth communication.
After a lot of efforts I managed to dig into more in the educational system of New York, me and the rest team of parents started to get involved with people that were familiar with those programs. Our main goal was to establish such a project. Being in touch for at least two years with DOE , superintended, principles, politicians, and bilingual New York communities ,we managed to complete our mission. Greek-American Dual Language program will be added to the bilingual education public schools September 2020.
So getting more involved to that type of bilingual education I found quite useful (for me and for other parents who are willing to learn their children natively more than two languages) to visualize some of the interest data sets that I found in New York Open Data.
The data for two types of bilingual education programs that exist in New York City Public schools are dual language programs (DLP) ), in which students “learn how to speak, read, understand, and write in two languages, and also learn about and appreciate other cultures,” according to the NYC Department of Education, and transitional bilingual education (TBE) where students start out learning in their home language with the intent of eventually moving into an English-only classroom. Dual Language program maintain a student’s good comprehension of a non-English language while a TBE program makes the student capable of learning in an English-only environment.
Using all the recent data of school year 2018–19 ,Bilingual Education Programs (Dual Language and Transitional Bilingual Education), I made an csv file and started cleaning as much as I can. Moreover in order to use longitude and latitude coordinates, I added in the same csv file, school location data that I found from NYC Open data as well.
I firstly started making in Tableau a pie chart to see clearly how many schools in the five boroughs have those types of bilingual education.TBE programs outweighs to DLP but the difference is subtle.
Then I wanted to see which Language predominates in the whole New York City area and how many languages are spoken through those type of bilingual education. Unsurprisingly the Spanish language is the predominant one as the Chinese language follows as a second one:
I tried also to make a map in Tableau showing with color coded dots in every different language. What I wanted to understand here was whether these programs were primary concentrated within neighborhoods with large immigrant populations. In this map the largest concentration of programs is found in the Bronx with Spanish-language being the first one in those programs. Chinese language programs were found mostly in China Town in Flushing in Queens and some areas of Brooklyn showing that those two language programs are located in areas with high concentration of native speakers. But would DL and TBE programs appear in other places with the same way?
Moreover, I found very useful to point out what type of school has those f language bilingual education programs. The above chart indicates clearly that Elementary schools are dominant in the whole boroughs. That could also make sense since the programs has to be familiar from a very early age of the kid (maybe Kindergarten class) as it’s mandatory every child at his age to develop academic and cultural competence and bilingualism from at least 9 year old in order to perform later academic level in two different language.
Another tree map that I found useful was to try to split all the bilingual schools per language (out of the 13 different languages that operate momentarily in the whole city) and then to try to demonstrate information through tool tips regarding the official name on each public school, the address which is located along with the area and the type of bilingual language.
Finally in the Map Info software I created the thematic map as I wanted to show foreign-born population ranges and at the same time with the point data showing the two types of language programs. This contains 36 schools that have Spanish and Chinese as DL and TBE bilingual programs. There is a clear dominance of Spanish-language programs, notably with a presence in both NTAs with a foreign-born population exceeding 50 percent and those with around a third or fewer. However in parts of Queens and central and central Brooklyn which the darker shades of purple, there are large gaps without any programs. In the Jackson Heights, Elmhurst, North Corona areas of northern Queens, there is a notable cluster of both DL and TBE programs unlike most other areas where there is a dominating point color – like in western Brooklyn and western Manhattan where the NTAs with relatively lower immigrant populations have a sizable number of DL programs.
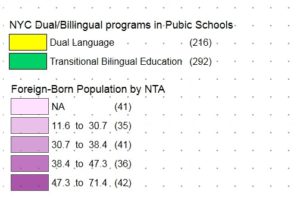
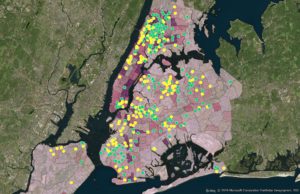 Comparing Bilingual Program Types and Foreign-Born Population by NTA

This entry is licensed under a Creative Commons Attribution-NonCommercial-NoDerivatives 4.0 International license.